Overview of the Indian Economy
India experienced robust GDP growth in the mid-2000s, exceeding 8% annually, but faced a slowdown to 6% following the global financial crisis of 2007-08. By 2012-13, growth further declined to about 4.5%. Although there was a brief surge between 2014 and 2016, growth slowed again after demonetization in 2016 and GST rollout in 2017, with GDP growth dropping to 3.9% by 2018. Post-pandemic, GDP growth rebounded to 7.3% and 7.4% in the two subsequent years, indicating recovery. In 2023-24, the GDP reached INR 296.6 lakh crore, growing by 8.9% at current prices and 7.4% at constant prices with 2011-12 as the base.
Primary Sector Contribution to GDP and Employment
In 2022-23, the primary sector in India, including agriculture, fishery, forestry, and mining, contributed to 20.2% of the GDP. However, fishery and forestry accounted for only 1.5% each, while mining contributed 2.5%. Agriculture, historically a major income source, comprised 16.7% of the GDP, with nearly 44% of the workforce engaged in it. The pandemic prompted urban migrants to return to rural areas, marginally increasing the agricultural workforce, despite its declining trend.
Secondary Sector Contribution to GDP and Employment
Between 2011 and 2021, India’s manufacturing sector’s contribution to GDP decreased from 17% to 13%. The sector is characterized by a significant portion of unorganized and household enterprises, which employ about 80% of the workforce but contribute minimally to value addition. Most manufacturing firms have fewer than 10 employees, with lower value added per worker compared to organized firms. Despite rising real wages, there has been a decline in wage shares in manufacturing. There’s a gradual transition from low- to medium-technology exports.
Services Sector Contribution to GDP and Employment
India’s services sector is pivotal to its economy, contributing significantly to GDP, exports, and employment. In 2022-23, it accounted for 53.33% of the total GVA, with 29% of national employment. While organized sectors like finance, insurance, and real estate play a key role, over 80% of employment in the services sector is in the unorganized segment, primarily in retail and wholesale trade. Additionally, the sector serves as a crucial source of foreign exchange earnings and attracts foreign direct investment.
Overview of India’s Foreign Trade
In the fiscal year 2021-22, India’s total trade reached USD 1436.59 billion, constituting about 45% of its GDP. Exports amounted to USD 676.53 billion, approximately 21% of the GDP, with a Domestic Value Added (DVA) of around 60%, contributing about 13% to the GDP. Imports totaled USD 760.06 billion, roughly 24% of the GDP, with a Foreign Value Added (FVA) of about 21%, which is netted off from the GDP.
Trend Over Time
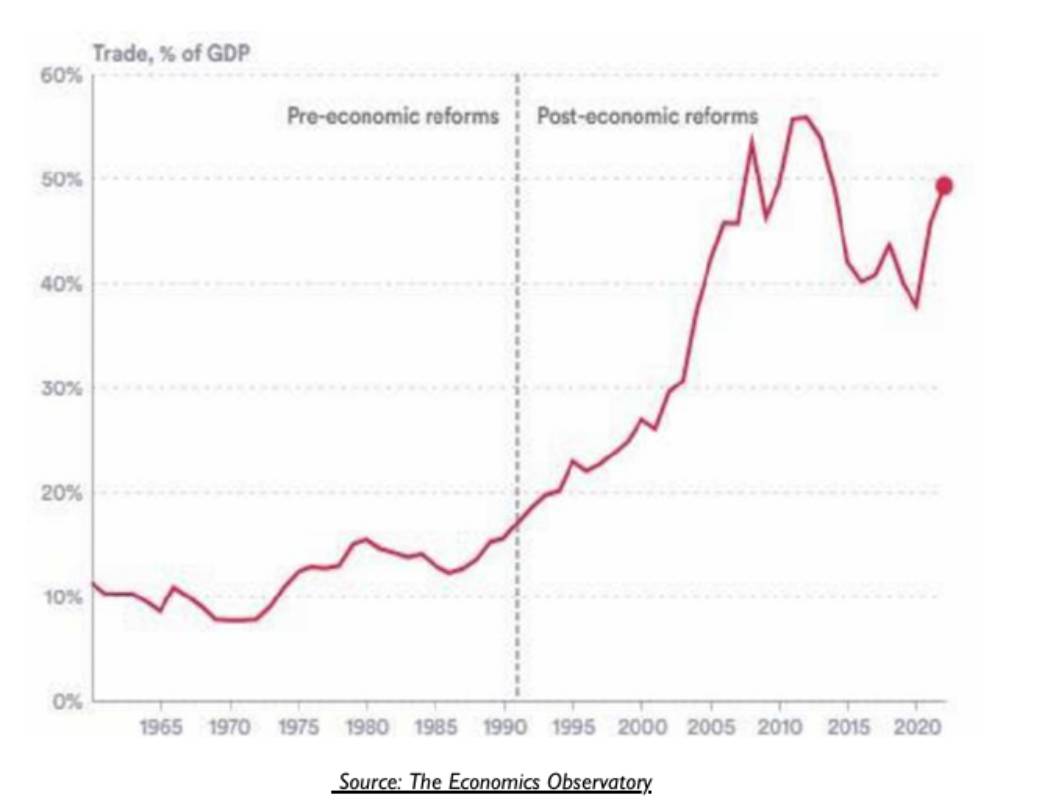
India’s international trade has grown substantially since independence, with total trade reaching USD 1436.59 billion by the 75th year of independence. Despite exports increasing from USD 1.23 billion to USD 677 billion over the years, India’s share of global exports declined from 2.6% in 1947-48 to 0.4% in 1992 before gradually rising again. Trade as a percentage of GDP initially declined but surged after liberalization in 1992.
Figure 1 – India’s Trade as a Percent of the GDP
Trade Deficit
Once China became a member of the WTO, and Indian tariffs were reduced for imports, the trade deficit went up exponentially. In 2012-13 the merchandise trade deficit was USD 192.87 billion. While it recovered for the three-year period between 2013-14 and 2017-18 due to a dramatic drop in crude petroleum prices, the trade deficit increased to $276.04 billion in 2022-23.
Top 10 Import and top 10 Exports

India’s trade data within the International Harmonised System (HS-2) reveals that while the top 10 imports, including minerals, pearls, electrical machinery, nuclear reactors, organic chemicals, and plastics, constitute 70.2% of total imports, the top 10 exports within the same categories contribute only 46.1% of total exports. This underscores the interdependence of imports and exports within the same product categories, signaling the integration of global value chains. Contrary to conventional wisdom, contemporary trade dynamics depict imports and exports as mutually reinforcing elements driving GDP growth, illustrating a circular relationship where the expansion of one sector fuels the other.
India’s Exports
Merchandise Exports
Mineral fuels, oils and products of distillation, natural reactors, boilers, machinery, iron and steel, organic chemicals, electrical machinery, vehicles other than railway or tramway, pharmaceutical products, cereals, cotton, aluminium and articles thereof, articles of iron and steel, articles of apparel and clothing, miscellaneous chemical products, fish and crustaceans, other made up textile articles, sugars and sugar confectionary, rubber articles thereof which belong to the HS-2 product code categories and together accounted for 79.9 percent of India’s exports in 2021-22.
Services Exports
From 2011-21, services contribution to exports increased from USD 138.07 bn to USD 309. 47bn. India was eighth amongst the top ten exporters of service in the world. Information technology, in which the country is a global leader, accounted for $ 108 billion of services exports in the FY 2022-23, exporting primarily to the US, UK and the EU.
Contribution of Exports to GDP
Das and Kukreja (2020) analysed the Domestic Value Added (DVA) in India’s export sub-sectors. In 2013-14, DVA ranged from 88-99% in agricultural items to 54-95% in manufacturing. The share of DVA in India’s exports decreased from 84.13% in 2003-04 to 72.79% in 2013-14, likely averaging around 60% presently due to increased reliance on imported inputs, particularly in the secondary sectors. Services remain an exception with consistently high DVA content.
Table 8: Sector-wise Domestic Value Added (DVA) as a % of export value of that sector in 2013-14
| Export Sub-sector | DVA as a percent of export value in 2013-14 |
| Agricultural items | 88-99% |
| Mining and Quarrying | 66-93% |
| Manufacturing | 54-95% |
| Services item | 60-93% |
Source: Das and Kukreja, 2020, pp-11-14
Comparing the gross value of foreign trade with GDP directly can be misleading as GDP figures are not calculated in terms of gross value of output but as output minus input, or gross value added (GVA). Therefore, to truly understand the impact of exports on GDP, it is crucial to focus on the GVA of exports. Deducting input value will give us the GVA of exports. But as exports also have some component of imports, these need to be deducted so that we can come up with the domestic value added (DVA), which is the true additionality of exports to the Indian economy.
The DVA of exports varies from sub-sector to sub-sector, and the range is wide, from as low as 10 percent in case of petroleum products to as high as 95 percent for agricultural products and some services, as estimated by Das and Kukreja (2020).[1] They showed that the DVA of exports has declined steadily from 84.1 percent in 2003-04 to 72.8 percent in 2013-14. Assuming the DVA of exports was at about 60 percent in 2021-22, India’s DVA from exports constituted about 13 percent of the GDP for that year.
Thus increasing exports by 10 percent could enhance the GDP growth by 1.3 percent. It should be noted that the growth is not merely quantitative, but exports generally tend to diversify a country’s basket of goods and services, thereby increasing its Economic Complexity Index (ECI), which is a relative measure of the knowledge intensity of an economy
Contribution of Exports to Employment in Various Sectors

One comprehensive study on this was by Das and Kukreja (2020) of ICRIER. The total number of jobs per million dollar of exports reduced from around 450 in 2003-04 to as low as 183 in 2013-14, and using this as a trend we can derive that jobs would reduce to around 80 / million dollar of exports. The employment in exports was estimated to be 7.3 crore in 2013-14 by them. To this, we applied the growth in exports and adjusted the additional employment per million USD of exports from 183 to about 80, based on the trends in the previous decade.
During the late 1990s and early 2000s, agriculture dominated export-supported job creation, but its share gradually declined to 40% by 2012-13. Meanwhile, services sector exports grew to account for 21.5% of employment, with IT, financial, and transport services leading. Manufacturing exports initially surged to 38.5% in 2012-13 but sharply declined to only 11.6% in 2021-22. Traditional labour-intensive sectors like textiles saw a decline, impacting job creation. Despite India’s competitive advantage in labour-intensive sectors, exports have leaned towards capital-intensive products, reflecting a shift towards higher technological content. This transition has led to significant annual losses in low-scale manufacturing activity.
Criterion for Selection of Sub-Sectors for Export Led Growth and Employment
Exports with a Revealed Comparative Advantage (RCA) about to Cross a Threshold
The concept of Revealed Comparative Advantage (RCA), introduced by Bela Balassa, helps identify a nation’s export competitiveness in various product categories. Ismail and Ahmed’s analysis revealed India’s steady progress in export competitiveness across different product groups, particularly in secondary products. Notably, India maintained RCA greater than 1 in 41 out of 97 product code categories at the HS-2 level between 2000 and 2018. Among these, significant improvements were observed in 11 categories, where RCA shifted from below 1 to above 1, indicating enhanced comparative advantage. Shahzeb et al. found that out of 558 products exported by India in 2018, 375 had RCA>1 at the HS-4 digit level, highlighting India’s dominance in those products. Policy support and incentives are recommended for products with RCA between 0.5 and 1.0 to further boost exports.
Criteria for Selection and Sub-Sectors Selected for Export Promotion
| Criteria | Sub-Sector Selection |
| a. Salience | Sub-sector accounts for at least 0.5% of total exports |
| b. Competitive Advantage | RCA has steadily increased over the last two decades |
| c. High Domestic Value Added (DVA) | High percentage of domestic value added in export value |
| d. High Employment Coefficient | High number of workers per USD-million of exports |
| e. Skilled Workforce | Higher proportion of more educated workers within employment |

Using the criteria from above, the following subsectors were selected for export promotion: We’ve identified key sectors for export promotion based on several criteria:
- Agricultural Commodities: While traditional exports like rice and sugarcane have high water-use intensity, we propose shifting focus to pulses, oilseeds, vegetables, and fruits with organic certification. These items align with salience, high Domestic Value Added (DVA), and generate significant employment, including skilled workers.
- Processed Foods: This includes a variety of products such as fish, meat, dairy, and processed fruits and vegetables. They contribute to salience, high DVA, and employment, particularly among skilled workers.
- Gems and Jewellery: To maintain India’s lead, emphasis should be on value-added products like branded jewellery, promoting domestic value addition and skilled employment.
- Textiles and Clothing: Despite falling behind, this sector remains a significant employer, especially for semi-skilled workers, particularly women. Strategic attention is needed to improve India’s global position.
- Metals and Metal Products: Shifting towards value-added products like structural steel and stainless steel can enhance domestic value addition and create employment for educated workers.
- Chemicals and Pharmaceuticals: With a focus on organic chemicals, speciality chemicals, and medicinal drugs, this sector offers high DVA and employment, with a growing proportion of educated workers.
- Automobiles and Auto Components: India’s success in this sector is evident, with significant exports and employment opportunities, including for educated workers.
- Electronics Products and Components: Moving towards becoming a major electronics exporter presents opportunities for high DVA and employment, particularly among educated workers.
- Services Sectors: While IT-based services continue to lead, caution is warranted regarding the potential impact of AI on lower-end coding jobs. Promising sub-sectors include electronics systems design, healthcare, and tourism, all of which demand workers with advanced degrees.
Recommendations for Enhancing Exports
What can be done to reap benefits of growth and employment? Looking at subsectors, crosscutting issues which withhold exports and suggest ameliorative measures for export promotion.
Resolving Issues vis-a-vis the WTO
India’s journey with GATT since 1948 and WTO since 1995 has transformed its trade landscape. Preceding its WTO entry, India slashed import tariffs significantly, leading to a notable drop from 25% in 2000 to 5-10% in the past decade. Trade volume soared, rocketing from USD 86.5 billion in 1999 to USD 1437 billion in 2022, elevating India’s global trade share from 0.6% in 1995 to 2.6% in 2022. The export composition transitioned from primary sector dominance to a substantial focus on manufactured goods and services.
While liberalized imports benefited consumers, they posed challenges. Domestic production and employment in micro and small enterprises dwindled, exacerbating the trade deficit, which exceeded USD 150 billion by 2022. However, India coped through substantial inward remittances from overseas Indians totalling USD 111 billion and a significant inflow of foreign direct investment, amounting to USD 71 billion in 2022.
Joining the WTO has brought both benefits and challenges for India’s economy. While it facilitated economic growth, it also triggered various difficulties:
- Lowering tariffs, especially on daily commodities, flooded the market with imports, particularly from China, leading to the closure of numerous small and medium enterprises across sectors like hand tools, sports goods, and wooden furniture.
- Compliance with WTO’s Trade Related Intellectual Property (TRIPS) agreements compelled India to open its borders to international service providers, necessitating protections for various intellectual property rights.
- India encountered opposition from other nations regarding its domestic policies, such as minimum support prices for agricultural produce and subsidies for exports. These disputes often escalated to the WTO Dispute Settlement Body (DSB), with over 50 disputes involving India since 2016.
For instance, India filed a complaint against the US in May 2018 for imposing additional import duties on steel and aluminium products, which took nearly five years to resolve. Conversely, disputes initiated against India, like the EU’s challenge to India’s tariffs on mobile phones, resulted in rulings against India, impacting its trade policies. Additionally, controversies surrounding India’s support measures for the sugar sector led to disputes with countries like Brazil, Australia, and Guatemala, with a WTO panel ruling against India’s subsidies in December 2021.
Multi-Pronged Action on Foreign Trade

India takes measures to counter unfair trade practices through the Directorate General of Trade Remedies (DGTR), which recommends countervailing duties against dumping instances, such as steel products from China, Vietnam, and South Korea.
To bolster export promotion, India actively engages in signing FTAs/RTAs with various countries, including Mauritius, Argentina, ASEAN, and most recently EFTA. Negotiations for an FTA with the UK are also in progress.
Streamlining regulations and procedures is crucial for enhancing export competitiveness. This involves initiatives like implementing single window clearance, tax-related reforms, and simplifying export documentation processes.
Efforts to strengthen export infrastructure are underway, addressing logistics costs and limitations. Initiatives like the GatiShakti National Master Plan and the National Logistics Plan focus on developing rail, highway, and port infrastructure. The Sagarmala scheme and the establishment of the NTCWPC at IIT Chennai aim to enhance port capacity and efficiency.
Suggestions for enhancing exports of selected sub – sectors
Agriculture remains India’s largest economic sector, contributing 13% to the GDP and employing nearly 45% of the workforce in 2021-22. It generates the highest number of jobs per million dollars of exports compared to other sectors. In 2021-22, agricultural exports reached a record US$ 50 billion. Major export categories include cereals, cotton, fish, sugar, coffee, tea, spices, and meat. However, the share of agricultural exports in total exports declined from 14% in 2013-14 to 9.5% in 2021-22. With agricultural exports primarily driven by unskilled rural workers, enhancing them can boost job creation and wage rates, making it a desirable objective.
Environmental Sustainability Issues in Agriculture Exports
Gulati and Juneja (2021) argue for a shift in India’s agricultural export strategy due to environmental concerns, highlighting water stress and greenhouse gas emissions associated with crops like rice and sugar. They propose incentivizing water-efficient farming practices and promoting less water-intensive crops like pulses and oilseeds.
Similarly, Saxena et al. (2023) advocate diversifying agricultural exports beyond traditional products, focusing on fruits, vegetables, dairy, and meat. They recommend export incentives, improved logistics, branding, and digitalization.
Kavita Kuruganti (2021) suggests reforms including expanding farmer-friendly mandis, supporting direct marketing, redesigning warehouse receipt schemes, diversifying procurement, and empowering Farmer Producer Organizations (FPOs).
Key recommendations for promoting agricultural exports include:
– Focus on less water-intensive crops like pulses and oilseeds.
– Improve logistics and infrastructure for perishable goods.
– Invest in branding, marketing, and digitalization.
– Implement reforms to support farmers such as expanding mandis and empowering FPOs.
These measures aim to enhance sustainability, profitability, and resilience in India’s agricultural sector.
Manufacturing Exports: Textiles, Pharma, Electronics, Autos and Components
India’s manufacturing exports have declined from 76% in the early 2000s to 62% in FY 2021-22, while China maintains a 93% share. Despite India’s significant industrial production in sectors like chemicals, pharmaceuticals, and food products, its export portfolio differs, with petroleum products, gems, and textiles dominating.
There’s a growing global demand for medium-tech items, yet India’s market share remains at 1%, despite significant imports totalling $100-120 billion. The Federation of Indian Exporting Organizations (FIEO) calls for a thorough analysis to address this decline, focusing on cost reduction, efficiency enhancement, quality assurance, and innovation.
In textiles, India ranks second globally but struggles to increase its share compared to China, Bangladesh, and Vietnam. Initiatives like the Amended Technology Upgradation Fund Scheme (ATUFS) and Mega Integrated Textile Regions and Apparel (MITRA) Parks aim to boost competitiveness, yet market share remains stagnant. Recommendations include more R&D investments, global marketing efforts, and exploring new markets.
The pharmaceutical sector is a global leader in generics, with exports reaching $24 billion in 2021-22. India’s dominance in vaccine production during the COVID-19 pandemic underscores its significance. To reduce import dependence, initiatives like the Production Linked Incentive (PLI) scheme and domestic production schemes have been launched.
Electronics exports are rising due to government initiatives like the PLI scheme. Despite tariff disputes, smartphone exports are increasing, though still lagging behind China.
The automobile sector has seen remarkable growth, contributing 7.1% to GDP and providing employment to over 19 million people. However, SMEs face challenges in internationalization due to barriers like supply chain issues, quality standards, and entrepreneurial limitations. Education programs for SME entrepreneurs are recommended to address these challenges and enhance export potential.
Services Sector Exports – IT, ESD, Health Care, Tourism
India’s service sector holds immense potential for export growth. The IT sector is a major contributor, but faces challenges like increasing competition and evolving client preferences. To address this, India can focus on the growing domestic market and adapt to meet client needs.
The government is prioritizing skilling in the Electronic Systems Design and Manufacturing (ESDM) sector to meet the projected growth. Medical tourism is another promising area, with a growing market and potential for job creation.
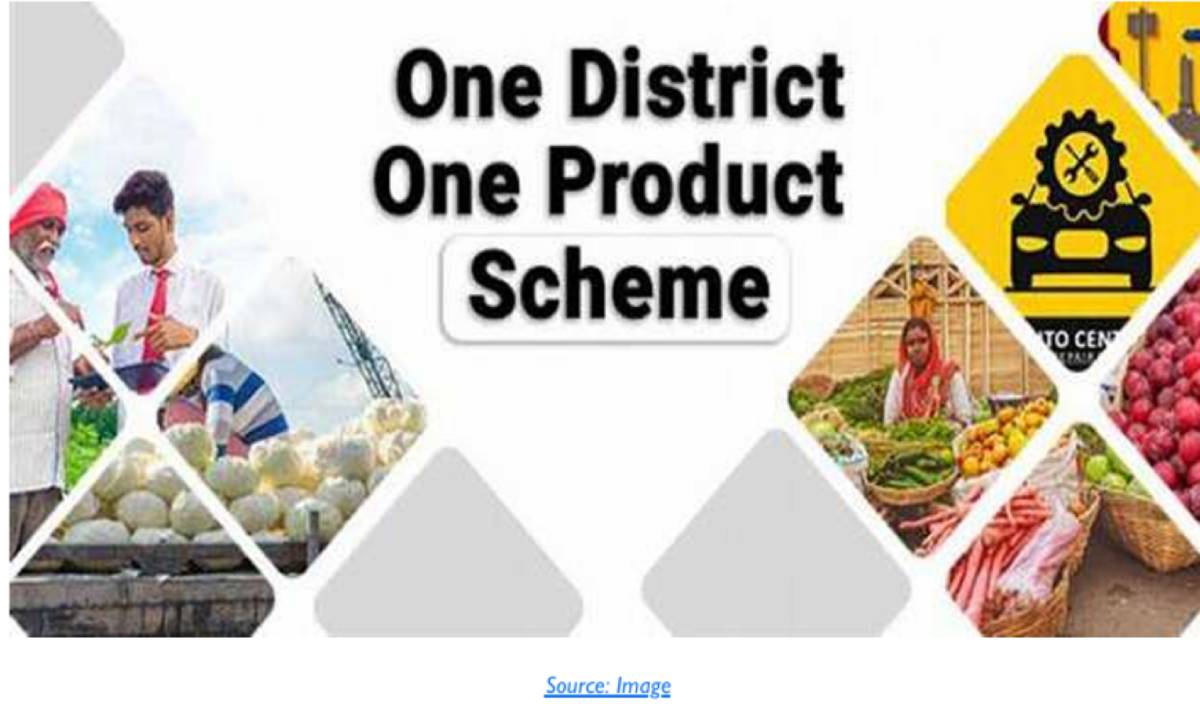
Strategies to boost service exports include expanding focus to regions with higher per capita income and establishing more export clusters within India. This can be achieved by strengthening trade promotion efforts and developing new clusters using Geographical Indicators (GI) and the One District One Product scheme.
Possibility of Growth and Employment through Import Substitution
India’s import dynamics in FY 21-22 were characterized by a total of USD 760 billion, comprising USD 613 billion in merchandise imports and USD 147 billion in services imports. Key imports included Petroleum Crude and Products at 26.4%, Electronics, Telecom, and Computers at 9.2%, Gold at 7.5%, and Vegetable Oils at 3.1%. Notably, China was the largest import source at 15.4%, followed by the UAE at 7.3%, and the US at 7.1%. The trade deficit, particularly pronounced with China at USD 73.3 billion, accounted for 88% of the total trade deficit, prompting India’s decision to opt out of the Regional Comprehensive Economic Partnership (RCEP) due to concerns over trade imbalances.
In terms of its impact on GDP growth, imports represented 24% of India’s GDP in 2022, with net imports (after deducting domestic value added) accounting for around 18-20% of GDP. While aiming for a “zero import” economy is impractical, reducing reckless imports remains a significant goal. The employment impact of imports has been notable, with employment foregone due to imports rising from 5.8% in 1993-94 to 19.3% in 2013-14. Import substitution has been identified as a potential solution to create jobs, but its success requires a strategic approach.
Several factors impede India’s import substitution efforts, including the lack of competitiveness and efficiency in domestic industries, integration into the global economy with constraints from trade agreements, and challenges such as outdated technology, infrastructure limitations, and bureaucratic hurdles.
Criteria for selecting sub-sectors for import substitution have been carefully outlined, including salience (accounting for at least 0.5% of total imports), cost competitiveness compared to global production, export contribution, employment generation, long-term capability enhancement for a higher Economic Complexity Index (ECI), and strategic importance for national defense or emergency preparedness. Sub-sectors selected for import substitution include renewable energy as a substitute for petroleum-based fuel, domestic coal for power generation, iron and steel for domestic production, machinery including mechanical and electrical imports, electronics including chips and components, and edible oils to be substituted with domestically grown oilseeds.
The Production Linked Incentive (PLI) Scheme, aimed at export promotion via import substitution, encompasses 14 sectors such as mobile manufacturing, pharmaceuticals, and electronics. The scheme has shown progress with over INR 1.03 lakh crore invested, leading to INR 8.61 lakh crore in production and the generation of 6.78 lakh jobs. However, challenges persist, including high costs, infrastructure issues, bureaucratic hurdles, and trust issues with the scheme’s guidelines, emphasizing the need for continued reforms and strategic implementation.
Policies for selective import substitution
Import Substitution Policies for Selected Sectors
Edible Oils
India imported 16.47 million tonnes of edible oils in 2021-22, worth Rs 1.56 lakh crore, with only 38.6% domestically produced. Table 17 highlights significant growth in various oils’ domestic production from 2013-14 to 2022-23. The ‘Atmanirbhar Oil Seeds Abhiyan’ targets key oilseeds like mustard, groundnut, and soybean, aiming to boost cultivation through research and modern farming techniques. Suggestions include incentivizing farmers and private partnerships for oilseed cultivation and research.
Renewable Energy
India’s heavy reliance on imported crude oil and coal, despite ample renewable energy potential, prompted strategies to reduce imports. Renewable energy contributes 30.2% to total energy capacity, with solar power alone meeting 7% of energy needs by 2022. Challenges include heavy reliance on imported solar panels, with China supplying 92% in FY 2022-23. India promotes domestic production, especially in electric vehicles (EVs) to reduce imports.
Iron and Steel
The PLI scheme targets the iron and steel industry, with investments of ₹29,530 crore and downstream capacity addition of 24.78 million tonnes. India aims to reduce steel imports and become a net exporter. Challenges include competition with China’s steel exports, leading to anti-dumping duties. Strategic focus on steel is vital for import substitution.
Electronic Appliances and Mobile Phones
India’s focus on local production in electronic goods aims to meet domestic demand, reducing imports. The mobile phone manufacturing sector shifted towards import substitution since 2014, with 120 manufacturing units established. Initiatives like duty barriers and strategic localization efforts have boosted local production. The sector expects significant export growth, generating substantial employment and boosting the Economic Complexity Index (ECI).
Addressing Trade Deficit with China
India-China trade dynamics show a rising trade deficit, reaching USD 104 billion in 2022. A detailed study of imports from China reveals significant categories, including electronics, machinery, organic chemicals, and toys. The challenge lies in addressing cost and technology disadvantages compared to Chinese counterparts. Studies suggest nuanced strategies beyond tariff barriers, focusing on joint ventures for global markets rather than direct competition.
India’s import substitution efforts in key sectors like edible oils, renewable energy, iron and steel, and electronics are crucial for reducing the trade deficit and enhancing self-sufficiency. Targeted policies such as the ‘Atmanirbhar Oil Seeds Abhiyan’ and the PLI scheme show promising results, but challenges remain, including heavy reliance on imports for critical components. A balanced approach involving incentives for domestic production, strategic localization, and collaboration with foreign manufacturers is necessary for sustainable import substitution and economic growth.
Conclusion
Trade and GDP share a circular relationship, where growth in one promotes growth in the other. Both export promotion and import substitution contribute to GDP growth, with data showing their complementary nature. The top ten product code categories for imports align with those for exports, as do the top ten export destination regions with import sources. Thus, enhancing foreign trade (exports plus imports) is integral to achieving GDP growth.
However, employment growth requires focused policy direction. Higher imports do not necessarily lead to increased employment, as highlighted by Tandon (2022), showing a shift from 8.7 million jobs created in 1993-94 to 7.1 million jobs foregone in 2013-14 due to imports.
While exports boost employment, not all exports generate employment proportionate to investments made. Petroleum product exports, exemplified by Reliance Jamnagar Refinery, had a low Domestic Value Added of less than 10%, despite a substantial export value of Rs 387,500 crore in 2021-22. In contrast, sectors like clothing and footwear manufacturing require lower investment per worker, creating more jobs for the same amount invested.
India must balance its investment pattern to prioritize employment generation, considering its high levels of poverty, income inequality, and unemployment rates. The strategy for foreign trade should target subsectors that create jobs for both educated unemployed and underemployed rural workers. Incentivizing medium technology manufacturing exports can be crucial, as low-tech exports may struggle against foreign lower-cost producers.
Additionally, India should incentivize exports in agriculture and allied subsectors, which provide jobs in rural areas for less educated workers. The proposed strategy of Employment-Linked Incentives for export by Industries and Rural areas (ELIXIR) aims to boost GDP growth while generating employment across the economy.
To create jobs for highly educated workers, India should maintain its dominant position in IT services exports. Diversification into high-tech services supporting aerospace, pharmaceuticals, automobiles, and engineering R&D, as suggested by Rajan and Lamba (2023), could further this goal. This comprehensive approach aims to leverage foreign trade for both GDP growth and widespread employment generation.
[1] Das, Deb Kusum; Kukreja, Prateek (2020) : Value addition, jobs and skills: A study of India’s exports, Working Paper, No. 392, Indian Council for Research on International Economic Relations (ICRIER), New Delhi, p.14