A presentation titled Bihar – Dasha aur Disha was made by an RGICS Team at Bihar Vimarsh, Muzaffarpur, 21May 22. Its first half- Dasha – or status report is presented below. The second half – on Disha – direction for progress is also available to interested readers upon request. Both part of the presentation are available in Hindi as well.
Environmental Conditions of Bihar
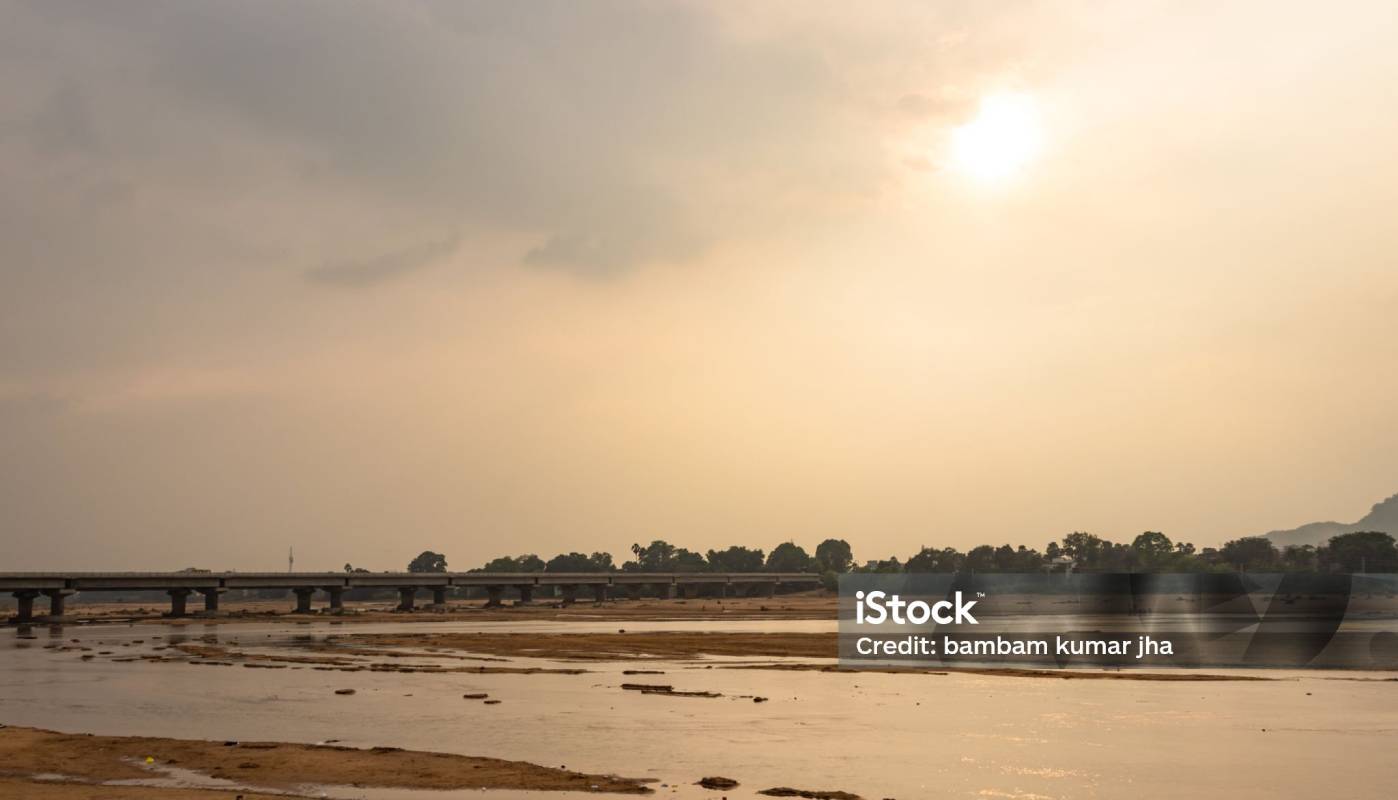
Jal – Water – Floods
- Bihar is India’s most flood-prone state, with 76% population in the North Bihar living under the recurring threat of flood devastation. Bihar makes up 16.5% of India’s flood affected area and 22.1% of India’s flood affected population.
- About 73.1 % of Bihar’s geographical area, i.e. 68,800 square kilometres out of 94,160 square kilometres, is flood affected. Sixteen per cent of the land mass of north Bihar is subject to permanent water logging.
- Floods are an annual phenomenon in North Bihar, due to five major rivers during monsoon – Mahananda, Koshi, Bagmati, Burhi Gandak and Gandak – which originate in Nepal. Some south Bihar districts are vulnerable to floods from Son, Punpun and Phalgu.
- In 2021, over 83.62 lakh people across 16 districts, 130 blocks and 1,333 panchayats were affected as per the Disaster Management Department.
- As per Government records, since 1979, over 9500 people died in floods. In 2021, flood-related deaths were 27. The highest 11 casualties were in Darbhanga district, followed by 6 in Muzaffarpur, 4 in West Champaran and 2 each in Saran, Siwan and Khagaria.
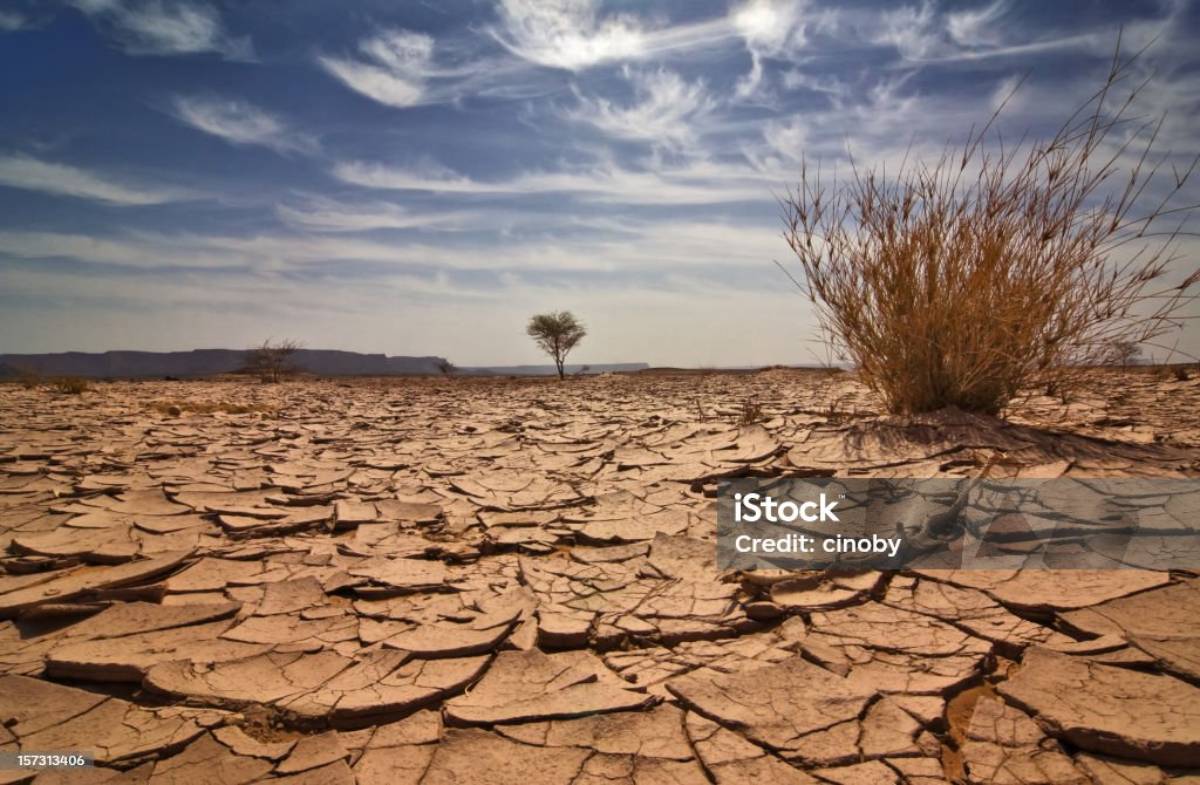
Jal – Water – Drought
- At the same time, there is water scarcity, even in the flood affected districts.
- The groundwater level has fallen in eight of Bihar’s 38 districts compared to 2020, as per a recent survey by the state’s Public Health Engineering Department (PHED).
- Eleven districts of the Bihar have been put in the ‘water-stressed’ category. Districts like Muzaffarpur, Darbhanga and Gaya are already facing water shortage with pumps, wells and ponds drying, according to media reports.
- Arwal, Banka, Kaimur, Bhagalpur, Samastipur, Bhojpur, Buxar and Patna are also staring at water crisis, which is imminent when groundwater dips below 25 feet.
- The survey categorised the panchayats into five groups according to the extent of depletion. The report termed 498 panchayats as ‘sensitive’.
Jangal – Forests
- Before the abolition of Zamindari, Bihar had a system of “private forests” and to ensure that these were not cut down, the Bihar Private Forest Act, 1947 was promulgated before the abolition of Zamindari. However, it had little effect. There was over 20,000 km² of private forests in undivided Bihar before 1947,
- Today, Bihar has a notified forest area of 7306 km², which is 7.76% of its land area, with only Kaimur and West Champaran having nearly 1000 sq km each, (Source: Forest Survey of India 2019)
- Bihar has 12 wildlife sanctuaries/national parks, the three biggest being Kaimur, Valmiki in West Champaran and Bhimbandh in Munger district.
- Only 121 of 8022 Individual Forest Rights claims received had been settled till Dec 2021, vs. 19.75 lakh out of 41.27 lakh claims All India as per MOTA website
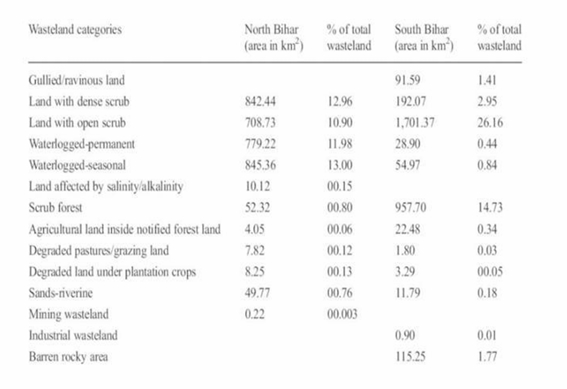
Jameen – Land and Soil
- Bihar has about 8.63% of the total population in the country while the share in total land area of India is only 2.86% or 9360 km2 of which 5353 km2 or 57% is net sown area (agri).
- Wasteland covers 6.90 % (6,501 km2) of the state with dominance of waterlogged areas in North Bihar (25.28 %) and scrubland (26.61 %) in South Bihar.
- With proper treatment, this wasteland has the possibility of generating livelihoods for 5 lakh landless families and another 5 lakh fisherfolk in waterlogged areas.
Social Conditions of Bihar
Scheduled Caste (SC), Scheduled Tribe (ST) and Vulnerable Rural Households (2011)
| State | SC% | ST% | Total population of SC, ST in 2011 |
| All India | 18 | 11 | 17.98 crore |
| Bihar | 17 | 2 | 1.78 crore |
| UP | 24 | 1 | 2.60 crore |
| Kerala | 10 | 2 | 0.63 crore |
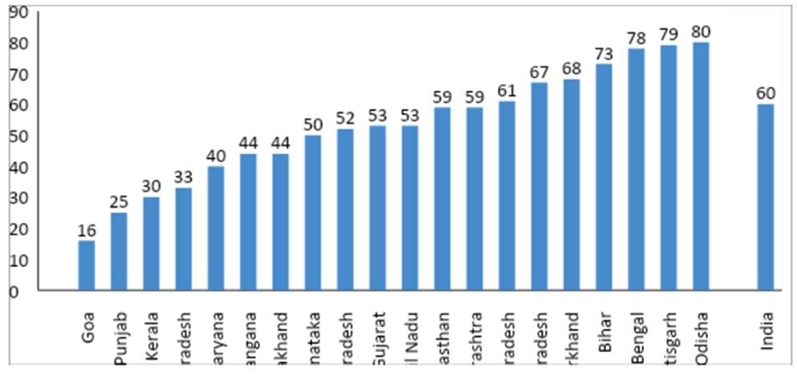
In Bihar 73% of the rural households or 1.3 crore households were identified as vulnerable as per the Socio Economic and Caste Census (SECC) 2011, as compared to UP 67%, Kerala 30% and All India 60%. This was despite less than national average of Scheduled Caste (SC), Scheduled Tribe (ST). After the split of Jharkhand, there is very little scheduled tribe population in Bihar.
Within Bihar, there is greater degree of vulnerability in North Bihar, where most districts (except Gopalganj, Chhapra and Siwan) have uniformly higher deprivation percentage. This is also reflected in higher percentage of landless casual labourers and lower educational attainment.
| District Name | %Deprived HH | Housing | SC/ST HH | Education | Landless Casual |
| All India | 49 | 13 | 22 | 24 | 30 |
| BIHAR | 61 | 20 | 16 | 34 | 47 |
| Katihar | 73 | 20 | 13 | 50 | 59 |
| Darbhanga | 73 | 39 | 15 | 45 | 57 |
| Khagaria | 73 | 35 | 13 | 43 | 61 |
| Kishanganj | 71 | 11 | 10 | 47 | 58 |
| Begusarai | 71 | 34 | 13 | 36 | 59 |
| Purnia | 70 | 18 | 15 | 47 | 53 |
| Saharsa | 70 | 32 | 17 | 43 | 54 |
| Araria | 69 | 22 | 13 | 43 | 52 |
| Sheohar | 68 | 19 | 14 | 46 | 53 |
| Sitamarhi | 68 | 24 | 11 | 45 | 51 |
| Munger | 68 | 23 | 15 | 32 | 60 |
| Madhepura | 67 | 27 | 16 | 47 | 44 |
| Samastipur | 67 | 33 | 18 | 36 | 50 |
| Vaishali | 66 | 29 | 20 | 31 | 56 |
| Supaul | 63 | 18 | 14 | 39 | 46 |
| W. Champaran | 61 | 15 | 19 | 36 | 48 |
| Muzaffarpur | 61 | 20 | 15 | 32 | 46 |
| Bhagalpur | 61 | 22 | 10 | 30 | 51 |
| Banka | 61 | 24 | 15 | 33 | 41 |
| E. Champaran | 60 | 17 | 11 | 33 | 48 |
| Madhubani | 59 | 20 | 12 | 33 | 43 |
| Patna | 57 | 14 | 16 | 28 | 50 |
| Gaya | 56 | 9 | 31 | 33 | 41 |
| Jamui | 56 | 16 | 19 | 30 | 35 |
| Lakhisarai | 55 | 17 | 14 | 30 | 44 |
| Sheikhpura | 55 | 13 | 20 | 32 | 47 |
| Nawada | 55 | 9 | 25 | 30 | 46 |
| Arwal | 54 | 10 | 19 | 24 | 47 |
| Aurangabad | 53 | 9 | 23 | 21 | 46 |
| Nalanda | 52 | 12 | 17 | 28 | 45 |
| Jehanabad | 52 | 11 | 17 | 27 | 45 |
| Bhojpur | 51 | 13 | 15 | 20 | 45 |
| Kaimur | 51 | 11 | 23 | 22 | 42 |
| Rohtas | 50 | 13 | 20 | 20 | 43 |
| Saran | 47 | 15 | 12 | 24 | 29 |
| Buxar | 44 | 7 | 15 | 15 | 38 |
| Gopalganj | 42 | 8 | 13 | 24 | 22 |
| Siwan | 42 | 10 | 13 | 21 | 25 |
Education
One in six children do not enter school. Of the ones who enter school, only one child out of five finishes higher secondary (12th). As can be seen from the table below, while the net enrolment rate in Bihar in the elementary level is only slightly less than the All India average and even the best state, Kerala, the enrolment rate drops at the secondary level to half of Kerala and then to one –fourth of Kerala by the Higher Secondary level.
Net Enrolment Rate by Gender and Level of School Education 2019-20
| State | Elementary (I-VIII) | Secondary (IX-X) | Higher Secondary (XI-XII) | ||||||
| Girls | Boys | All | Girls | Boys | All | Girls | Boys | All | |
| Kerala | 93 | 93 | 93 | 74 | 74 | 74 | 66 | 59 | 62 |
| Uttar Pradesh | 89 | 86 | 87 | 36 | 39 | 37 | 26 | 27 | 26 |
| Bihar | 87 | 83 | 85 | 36 | 34 | 35 | 16 | 16 | 16 |
| India | 91 | 90 | 90 | 50 | 50 | 50 | 33 | 31 | 32 |
Retention Rates across States in India by Level of Education
| State | Elementary (I-VIII) | Secondary (IX-X) | Higher Secondary (XI-XII) | ||||||
| Girls | Boys | All | Girls | Boys | All | Girls | Boys | All | |
| Kerala | 100 | 100 | 100 | 100 | 100 | 100 | 100 | 100 | 100 |
| Uttar Pradesh | 61 | 62 | 62 | 61 | 54 | 58 | 45 | 40 | 42 |
| Bihar | 73 | 79 | 76 | 43 | 46 | 45 | 19 | 19 | 19 |
| All India | 74 | 75 | 75 | 60 | 60 | 60 | 40 | 40 | 40 |
Dropout rate is higher among north Bihar districts. Dropout rates are higher for SCs as compared to OBC children in both upper primary than secondary levels in the most districts, but both are high.
Higher Education in Bihar
In 2020, Bihar had 35 universities and 874 colleges.
There are over 17 lakh students in higher education in Bihar, of which 2.1 lakh are in Universities and the rest in colleges/technical institutes.
Overall enrolment rates are 14.5%, while for SC women it is 8.5%. The state is taking steps for increasing the gross enrolment ratio in higher education to 50% by 2035. Gender parity index was 0.8 overall and only 0.6 for SC girls.
Bihar allocated 19% of its total expenditure to education in 2021-22 vs the average allocation (15.8%) for education by all states
Health as per NFHS IV and V
| Bihar Health Parameters –
National Family Health Survey |
NFHS-5 2019-20 | NFHS-4 2014-15 | ||
| Urban | Rural | Total | Total | |
| Access To Electricity | 96.2 | 96.3 | 96.3 | 60 |
| Access To Drinking Water | 99.5 | 99.2 | 99.2 | 98.4 |
| Access To Sanitation | 69.2 | 45.7 | 49.4 | 26.5 |
| Access To Clean Fuel | 78.6 | 30.3 | 37.8 | 17.8 |
| Access To Health Insurance | 11.6 | 15.1 | 14.6 | 12.3 |
| Neonatal Mortality Rate (NNMR) | 29.5 | 35.2 | 34.5 | 36.7 |
| Infant Mortality Rate (IMR) | 43.1 | 47.3 | 46.8 | 48.1 |
| Under-Five Mortality Rate (U5MR) | 50 | 57.4 | 56.4 | 58.1 |
| Antenatal Care 4 Visits | 32.4 | 24 | 25.2 | 14.4 |
| Iron Folic Acid For 180 Days | 15.3 | 8.3 | 9.3 | 2.3 |
| Mother And Child Protection (MCP) Card | 85 | 90.2 | 89.5 | 79.9 |
| Postnatal Care (2 Days) | 62.6 | 56.5 | 57.3 | 42.3 |
| Institutional Births (%) | 84.1 | 75 | 76.2 | 63.8 |
Bihar was ranked 18th out of 19 major states ranked on health status by the NITI Aayog. UP was the last at no 19. Kerala was number 1.
Between 2014-15 and 2019-20, there has been an improvement in most parameters related to child immunization, nutrition and adult nutrition.
The one exception in this regard is anaemia among women of all ages.
The budget allocation for health in Bihar was 6.3% of total expenditure, higher than the average allocation for health by all states (5.5%).
| Bihar Health Parameters –
National Family Health Survey Child Immunization, Nutrition and Adult Nutrition Status |
NFHS-5
2019-20 |
NFHS-4
2014-15 |
||
| Urban | Rural | Total | Total | |
| Children Age 12-23 Months Fully Vaccinated | 66.7 | 71.6 | 71 | 61.7 |
| Children Under 5 Years Who Are Stunted | 36.8 | 43.9 | 42.9 | 48.3 |
| Children Under 5 Years Who Are Wasted | 21.6 | 23.1 | 22.9 | 20.8 |
| Children Under 5 Years Who Are Severely Wasted | 7.7 | 9.0 | 8.8 | 7.0 |
| Children Under 5 Years Who Are Underweight | 35.8 | 41.8 | 41 | 43.9 |
| Women Body Mass Index (BMI) Below Normal | 18.7 | 26.9 | 25.6 | 30.4 |
| Men Body Mass Index (BMI) Below Normal | 12.9 | 23.8 | 21.5 | 25.4 |
| Non-Pregnant Women Age 15-49 Years – Anaemic % | 66.0 | 63.1 | 63.6 | 60.4 |
| Pregnant Women Age 15-49 Years – Anaemic % | 56.1 | 63.9 | 63.1 | 58.3 |
Economic Conditions of Bihar
GSDP, Per Capita Income & Unemployment
- Gross State Domestic Product (GSDP): The growth rate of Bihar’s GSDP (at current prices) was 9.8% in 2021-22, higher than the growth rate of India (8.9%). GSDP for 2021-22 (at current prices) was projected to be Rs 7,57,026 crore. This is an annual increase of 11% over the GSDP in 2019-20.
- Per capita income:
- The per capita income of Bihar in 2019- 20 (at constant prices of 2011-12) was Rs 34,413 or 8.8% higher than the corresponding figure in 2018-19.
- But it was less than a third of the average per capita income of India which was Rs 107,589 in 2019- 20 (at constant prices of 2011-12).
- Within Bihar, the per capita income varied from Rs 112,604 the highest in Patna district to Rs 17,569, the lowest in Sheohar dt. North Bihar districts have lower PCI
- Unemployment: According to the Periodic Labour Force Survey (July 2018-June 2019), the unemployment rate among all age groups in Bihar was 10.2%, significantly higher than that at the all-India level (5.8%).
Output (GSDP) and its Growth – Bihar vs Other States
Rs Billion (00 crore) at constant 2011-12 Prices
| GSDP in | 11-12 | 12-13 | 13-14 | 14-15 | 15-16 | 16-17 | 17-18 | 18-19 | 19-20 | 20-21 |
| Kerala | 3640 | 3877 | 4028 | 4200 | 4512 | 4853 | 5162 | 5497 | 5686 | 5143 |
| Uttar Pradesh | 7241 | 7582 | 8021 | 8344 | 9082 | 10115 | 10577 | 11240 | 11668 | NA |
| Bihar | 2471 | 2569 | 2696 | 2795 | 2965 | 3188 | 3440 | 3814 | 4096 | 4199 |
| All India | 87363 | 92130 | 98013 | 105276 | 113694 | 123081 | 131446 | 140033 | 145692 | 135127 |
| Growth rate of GSDP in % pa | 12-13 | 13-14 | 14-15 | 15-16 | 16-17 | 17-18 | 18-19 | 19-20 | 20-21 |
| Kerala | 7 | 4 | 4 | 7 | 8 | 6 | 6 | 3 | |
| U. Pradesh | 5 | 6 | 4 | 9 | 11 | 5 | 6 | 4 | |
| Bihar | 4 | 5 | 4 | 6 | 8 | 8 | 11 | 7 | |
| All India | 4.2 | 5.0 | 6.1 | 6.7 | 6.9 | 5.6 | 5.5 | 3.0 | -8.2 |
Per capita income District-wise for Bihar 2017-18
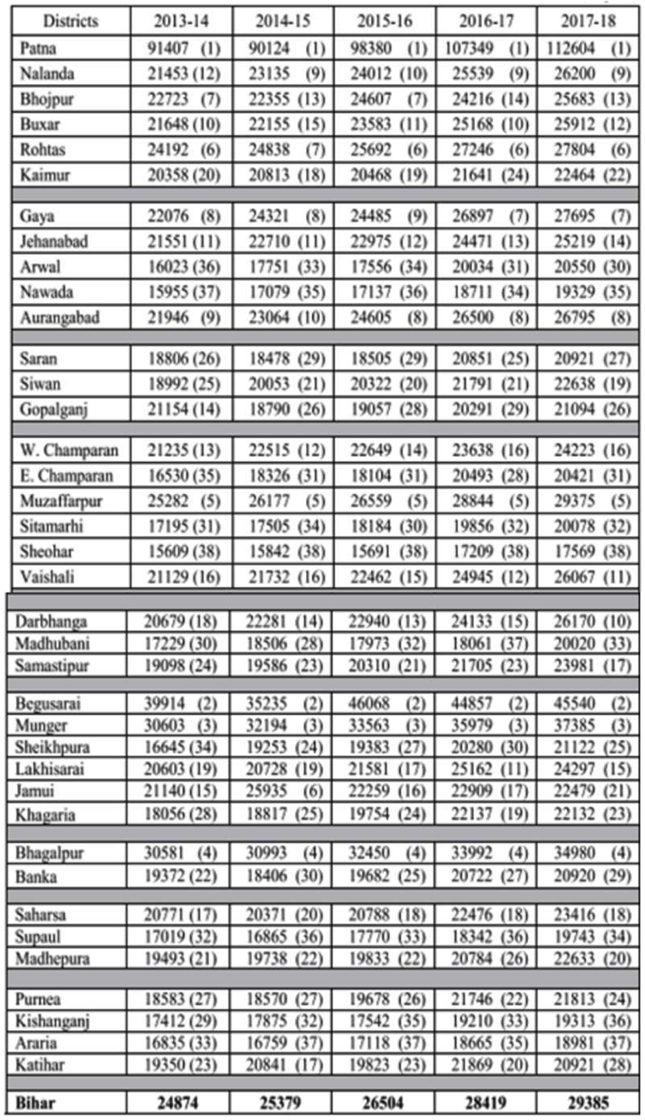
Patna, the most urbanised district, with a high share of non-farm sector services, construction and manufacturing, has the highest per capita income. This is followed by Begusarai, Munger and Bhagalpur, all more with more non-farm sector. The lowest are districts like Sheohar, Araria, Kishanganj, Sitamarhi and Madhubani – with flood affected agricultural livelihoods.
Agriculture
- Farm holdings are small and scattered. There are about 1.61 crore farm holdings of which 91 percent is marginal, with average holding size of 0.33 ha or 0.75 acres.
- Agriculture and allied sector contributes 18.9 percent of the GSDP. The rate of growth of agriculture and allied sector has been 5.4 percent during 2005-10 and 3.7 percent during 2010-14.
- The recurrent floods in N Bihar and droughts in S Bihar are major obstacles.
- In terms of yield, Bihar’s average is slightly above all India in wheat and paddy, and double of all India in Maize and pulses. Sugarcane is near average yield but lower in sugar content. Jute is grown in Seemanchal districts.
- Bihar is a major fruit and vegetable growing state. Total vegetable production in Bihar is about 157 lakh tonnes. Potato, Onion, Tomato, Brinjal, Okra and Cauliflower are the major vegetable crops.
- The four most important fruit crops in Bihar are mango, guava, litchi and banana.
- Processing of cereals, fruits, vegetables is minimal. Only sugarcane and milk are processed due to perishability.
Livestock
- Overall: Of the 36.5 million livestock in Bihar, 15.3 million are milch cattle, 7.7 million are buffaloes, and 12.6 million are goats. Bihar is not among the top 10 states in poultry.
- Dairy: Out of total 198 million tons of milk production in 2019-20 in India, Bihar accounted for a mere 10.8 million tons or about 5.5% as against about 7.7% of the cattle and buffalo population of India. The daily milk production of crossbred cattle is 6, 7, and 5.5 litres/day in the Northern, Central and Southern zones, respectively
- Milk Processing: Currently, there is a capacity to process 13% of the total milk produced into various milk products (pasteurized milk, UHT, powdered milk, ice cream, butter, ghee etc.). The govt has targeted that 32% of the milk will be processed by 2032–33.
- Fishery: The water area of Bihar constitutes about 3.9 percent of the total geographical area. In 2004-05, the production of fish in Bihar was 2.67 lakh tonnes. The production grew continuously thereafter and reached the peak level of 4.32 lakh tonnes in 2013-14.
Infrastructure, Industry & Services
- Infrastructure: Rail and highway network is adequate but mainly a “pass through” rather than used for local growth purposes. The construction of the Patna-Kolkata Expressway, covering about 450 kilometres is expected to cost Rs 18,000 crore has been announced. It will pass through five districts of Bihar.
- Power: Installed power generation capacity in Bihar was 6385 MW as of April 2020. New projects under construction which will take generation capacity to more than 12000 MW.
- Industrial sector is hampered by lack of infrastructure – power, district and city roads, industrial sheds, as well as inadequate credit from banks. Bihar has 68 industrial areas and mega industrial parks. Most are moribund.
- Service sector in Bihar is largely informal, covering retail trade, transport, storage, hotels and restaurants, and education, health and public services.
- Tourism. Foreign tourist arrival in Bihar was 10.9 lakh in 2019, about 10% of India. The main attraction is the sites related to Mahatma Buddha. Domestic tourism is largely religious and historical.
Financial Situation of Bihar – State Finances
Budget Highlights [1]
- Total expenditure for 2021-22 was estimated to be Rs 2,18,303 crore, an annual increase of 23% over the actual expenditure in 2021-21.
- Total receipts (excluding borrowings) for 2021-22 are estimated to be Rs 1,86,697 crore, an annual increase of 23% over the actual receipts in 2019-20. In 2020-21, total receipts (excluding borrowings) are estimated to fall short of the budget estimate by Rs 9,684 crore (a decrease of 5%).
- Revenue deficit in 2021-22 the state has estimated a revenue deficit of Rs 5,187 crore (0.8% of GSDP).
- Fiscal deficit in 2021-22 is estimated to be Rs 22,511 crore (2.97% of GSDP). As per revised estimates, in 2020-21, fiscal deficit is estimated to be 6.77% of GSDP, which is significantly higher than the budget estimate of 2.97% of GSDP.
State Budget Expenditure Pattern
The figures below compare Bihar’s expenditure on six key sectors as a proportion of its total expenditure on all sectors.
- Education: Bihar has allocated 19% of its total expenditure for education in 2021-22. This is higher than the average allocation (15.8%) for education by all states
- Health: Bihar at 6.3% has a higher than average allocation for health by states (5.5%).
- Agriculture and allied: Bihar 3.7%, much lower than the average allocation for agriculture by states (6.3%).
- Rural development: Bihar 11.6%, almost double average for rural development by states (6.1%).
- Police: Bihar 5.6%, higher than the average expenditure on police by states (4.3%).
- Roads and bridges: Bihar 3.8%, lower than the average allocation by states (4.3%).
- Committed expenditure (salaries, pensions, interest on borrowings) was 33.1%
Banking, Savings, Credit and Investment
- Branch Network: There were 6900 bank branches in Bihar in 2019, 5.7% of 145,000 all India. Population per branch was 16,000 vs 11,000 all India.
- Bank Deposits of Bihar in 2019 were Rs 3.5 lakh crore, or 2.6% of 136 lakh crore all India. Per capita savings was only about Rs 29,000 in Bihar as against about Rs 101,000 for India.
- Mutual Funds have become popular means of saving in Bihar. By 2022, the amount invested in MFs was Rs 32,254 crore. (Source: livehindustan.com dated 11 Feb 2022)
- Bank Credit in Bihar in 2019 was Rs 1.24 lakh crore, or 1.25% of Rs 98.9 lakh crore all India. Per capita credit was only about Rs 10,000 in Bihar as against about Rs 73,000 for all India. (Source: RBI). Thus for every Rs 100 saved in Bihar, only Rs 35 is coming back as credit.
- Credit through Self-Help Groups (SHGs) – As on 31 Mar, 2020, 6.9 lakh SHGs in Bihar were linked with Banks, with credit o/s of Rs 6,966 crore vs Rs 108,075 crore all India for 56.8 lakh SHGs (Source: NABARD SHG Report, 2021).
- Microfinance – There were 60 MFIs with 2103 branches, 45.34 lakh borrowers, Rs 9946 cr loans outstanding. Disbursement in 2021 was Rs 8,234 crore, 25% lower than 2020. Despite that Bihar was no 3 state in India in microfinance (Source: Bharat Microfinance Report 2021)
- Investment – In 2021, Bihar has received investment proposals worth Rs 39,000 crore. However, of this, Rs 30,382 crore were related to ethanol production alone. Foreign Direct Investment was Rs 1252 cr in 2021. (Source: Udyog Mitra, InvestIndia)
Development Programs for the Poor – Rations, MGNREGA
- As per the National Food Security Act (NFSA) portal, there were 1.79 crore ration card holders in Bihar and 8.71 crore people are benefiting from rations under the PDS.
- There were 22.9 lakh beneficiaries of the Antyodaya Anna Yojana (AYY) under which poorest households can purchase up to 35 kilograms of rice and wheat at a highly subsidised cost of ₹3 per kilogram of rice and ₹2 per kilogram of wheat. . Recall there were 1.3 crore vulnerable rural households in Bihar.
- There were 1.56 crore Priority Household (PHH) beneficiaries in the state for rural families. PHH cardholders are not in AAY, yet receive 5kg of food grains per person per month at the same price as AAY beneficiaries.
- As per the MNREGA portal, there were 2.41 crore Job Cards issued with 3.29 crore workers. However, only 82.8 lakh job cards and 92.6 lakh workers were actively engaged as on 11th May 2022, which is the peak season. Recall there were 1.3 crore vulnerable rural households in Bihar.
- In the COVID pandemic, MNREGA was used a lot. In FY 2020-21, and 2021-22, 2.28 crore and 1.82 crore person-days were generated, in 21 and 11 lakh works, with average wages of Rs 198 and Rs 194 per day respectively. The total NREGA expenditure was Rs 6425 crore and Rs 6514 crore respectively.
Under the Bihar Rural Livelihoods – Jeevika program, over 10.7 lakh self-help groups (SHGs) of women have been formed and 6.9 lakh SHGs in Bihar were linked with Banks, with credit o/s of Rs 6,966 crore. Total number of poor households covered is over 1.5 crore.
Saat Nishchay-2 Yojana: Rs 4,671 crore has been allocated in 2021-22 for this Yojana:
(i) creating centres of excellence in polytechnics and industrial training institutes,
(ii) establishing mega-skill development centre in each district, and tool rooms in each division,
(iii) providing grants up to Rs 5 lakh and loan up to Rs 5 lakh at a subsidised interest rate to youth and women for setting up new businesses,
(iv) providing cash incentive to female students: Rs 25,000 upon completing senior secondary and Rs 50,000 upon completing graduation,
(v) provision of telemedicine, pathology, and screening for diabetes, blood pressure etc. in primary healthcare centres,
(vi) housing for homeless and landless poor in urban areas, and shelter homes for old age persons in all cities
Under Digital Bihar Program, all students of Class VI and above will receive computer education and training from 2021-22 onwards.