Vision and Mission of ASA
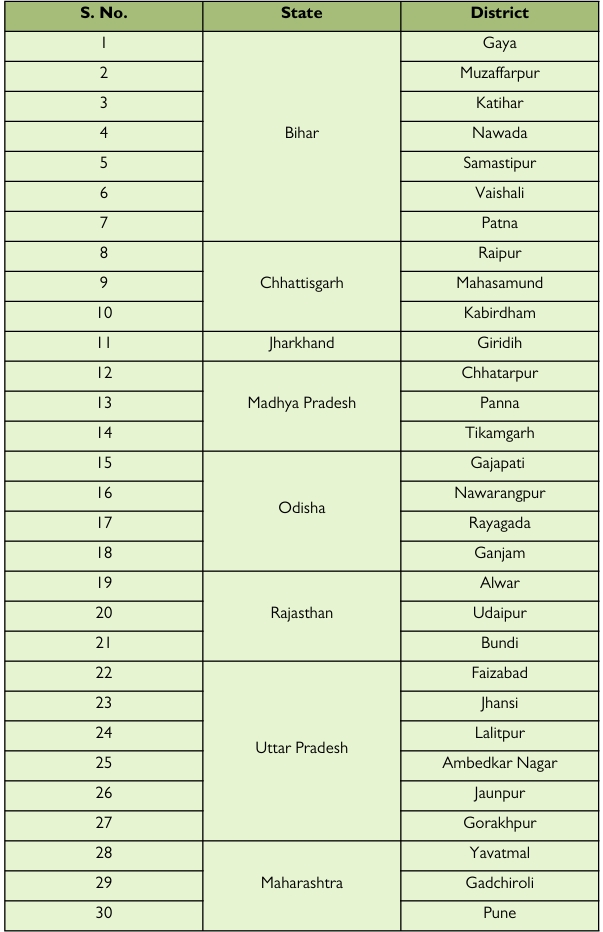
Due to the COVID pandemic, the livelihoods of many Prawasi (migrants) and Awasi (locals) were adversely affected across the nation. In order to address this mammoth adversity, Rajiv Gandhi Foundation (RGF) conceived a Abhiyan ‘Aajeevika Samvardhan Abhiyan (RGF – ASA)’, which is an innovative intervention for the revival of livelihoods. RGF – ASA endeavors to stimulate the emergence of Aspiring Micro-Entrepreneurs (AME) of each identified district. RGF – ASA commenced on 20th August 2020, and then after its successful implementation and positive results, the second Phase, i.e., Phase 2.0 was launched on 20th August 2021. Fourteen new districts were included in Phase 2.0. As a result, 30 districts across eight states were covered by ASA. Table 1 represents the list of the districts, broken down by state:
Table 1: Total Districts included in ASA
Major Takeaways
- Before entering the ASA Project, 30.2 percent of AME were unemployed, followed by laborers, the self-employed, and part-time employees. By the end of the Project, this changed to the establishment of business enterprise by all the AME.
- Before the commencement of ASA, nearly half of the AME population had an income of less than Rs. 1000 per month. As the Project went along, it was seen that the number of AME earning less than Rs. 1000 per month fell by nearly half due to the ASA project.
- AME earning more than Rs. 5000 per month before the ASA increased to almost four times after the ASA intervention.
- The findings demonstrated that the ASA Project, regardless of region, significantly raised the average monthly income of the AME by 23.3 percent.
- The average monthly income of AME women had increased by 9.3 percent.
- 36.7 percent of the AME had ‘selected the enterprise/activity’ on the advice of the Mentor. Odisha and Chhattisgarh were the states where more than half of the AME went by the guidance of Mentors.
- 57.4 percent of the AME had ‘selected the location of enterprise’ by themselves, indicating therein that many of the AME had adequate confidence to decide upon the location of their business activity.
- More than half of the AME respondents had chosen their ‘home’ as the location for the commencement of their enterprises, followed by enterprises set up in their own shops and rented spaces. About one-third of the women AME had chosen ‘home’ as the primary location for their enterprises.
- When it came to the issue of selection of enterprise location, almost one-third of the AME selected the location of enterprises on the advice of the Mentor. It was interesting to note that all the AME in Chhattisgarh went by the guidance of Mentors.
- AME, who had chosen their home to establish the enterprise, had saved on their other costs, like rent, transportation, food, travel, etcThe majority (35.6 percent) of the AME had ‘self-financed’ their enterprise.
- The credit availed by the AME from MFI was found to be the least among the five sources of finance.
- AME, who had pooled their own money for the establishment of the business, stated to have substantial improvements in the income from their enterprise. At the same time, none of the self-financed AME reported a decline in their income.
- More than half of the AME (61.7 percent) stated to have ‘strengthened their livelihood status’ through the ASA Project
- 12.6 percent of the AME in the ASA Project claimed that they could ‘overcome the challenge of the COVID-19 pandemic’ with confidence due to the ASA Project.
- About one-third of the total AME stated that they had undertaken product diversification to the existing enterprise. This was most pronounced in the case of the AME doing business from their home.
- The highest number of enterprises established by AME was kirana shops (grocery shops) at 18.4 percent, followed by goat rearing (12.4 percent) and tailoring (10.1 percent).
- The Project also considerably enhanced entrepreneurial practices in marketing and promotion, diversification of products, recordkeeping, and financial planning.
- The five modules (ABCDE) taught to the Mentors significantly impacted the direct and indirect success of enterprises managed by AME. Particularly Module A (Achievement Need Motivation) encouraged the Mentors to develop an entrepreneurial spirit among the AME. This was also evident from the AME responses, as 15.1 percent of AME stated that they anticipated seeing substantial growth in their enterprises in the near future, and 3.2 percent of AME stated that Mentors had instilled motivation in them.
- However, due to a lack of timely and adequate access to credit, the majority of AME went for self-financing.
- This study establishes an empirical and quantitative unique framework for successfully promoting micro-entrepreneurship in the rural areas of the nation.
- Most of the AME responded that their enterprise was growing gradually and is expected to improve soon.
- Through this analysis, the advantages of rural entrepreneurship are adequately accentuated, including the use of local skills and resources, the use of idle capital, and the creation of jobs for rural inhabitants.
- By assisting the AME in the selection of activities, creating business strategies, converging with government schemes, and forming alliances with relevant communities for support, ASA amply demonstrated the unique process for the pre-creation stage of enterprises.
- Project also established that capacity building for rural entrepreneurship had increased the productivity and proficiency of the local community, which further had a positive social impact as it developed easily accessible products and solutions to local problems.
- After two years of implementation of the Project, a favorable effect on wage work and motivational capacity was observed among the AME, highlighting the value of the intervention’s training component.
- The study provides definite evidence that entrepreneurship capacity-building interventions and motivational inputs for people in rural and semi-urban areas may successfully improve the entrepreneurial abilities and skills of the rural and semi-urban population..
- The Project had considerable impacts on the skillset, operations, and motivation for entrepreneurship.
Findings of ASA Implementation
After the culmination of the Project in June 2022, an Impact Analysis study was conducted. The responses to 12 sets of questions were designed to measure the impact of the ASA Project by understanding the scope and magnitude of the intervention on the revival of livelihoods of AME, which were captured in descriptive statistics, inferential statistics, and correlations.
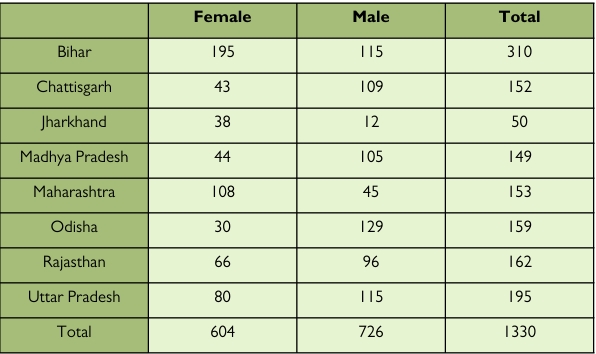
Table 2: Respondents of the Impact Evaluation Study
AME Profile
Generally, programs designed for micro and small enterprises aim to give prospective entrepreneurs the knowledge and resources they need to commence their own businesses, emphasizing fundamental human capital traits – like accountability, timeliness, and perseverance. An important factor to consider when evaluating the program is whether participants were actively engaged in entrepreneurial activities, given that it instructs them on managing and enhancing their businesses (International Initiative for Impact Evaluation Report, 2016).
Table 3: Status of AME before ASA (In Percent)
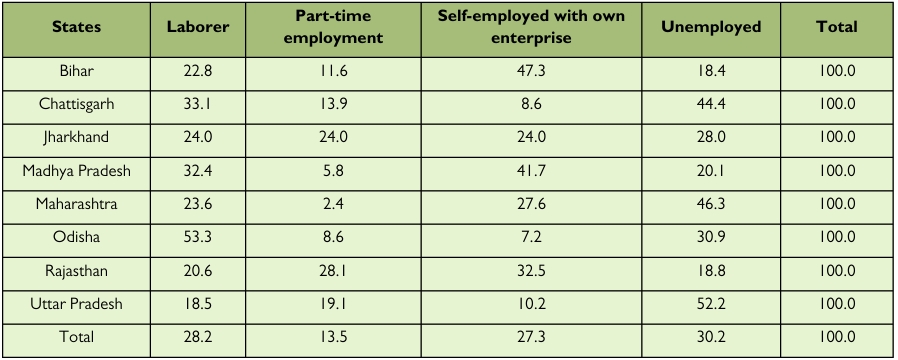
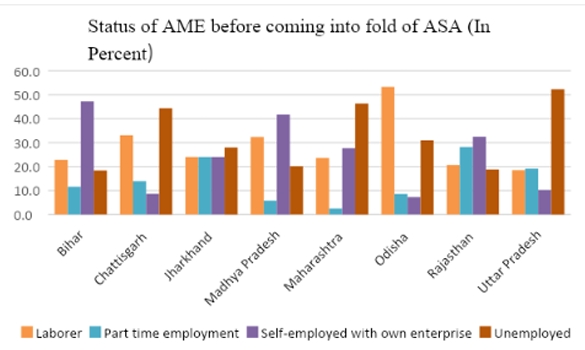
Figure 1: Status of AME before coming into fold of ASA (In Percent)
a) Before entering the ASA Project, 30.2 percent of AME were unemployed, followed by laborers, self-employed, and part-time employees (Table 3 and Figure 1).
b) More than half of the AME were laborers in Odisha, and more than half of the AME were unemployed in Uttar Pradesh when the Project commenced.
c) The data revealed that AME in the ASA Project had a mean age of 34 years.
Women’s Participation in Project
Researchers have turned to develop a comprehensive definition of women entrepreneurs in response to the rise of women in the field of entrepreneurship. Women entrepreneurs are those who assume responsibility for organizing and managing the resources of their businesses, as well as taking any associated risks in the hopes of making a profit (Tiwari, N., 2017).
Entrepreneurship has proven to be advantageous for women living in rural areas because it allows them to contribute to the family’s income while taking care of the farm, the house, and the livestock (Sidhu and Kaur, 2006), in addition to the significant societal and economic benefits that are important in this relationship (Tiwari, N. 2017). Additionally, female entrepreneurs benefit from entrepreneurship training since it boosts their self-esteem and sense of empowerment.
Table 4: Female and Male AME (In Percent)
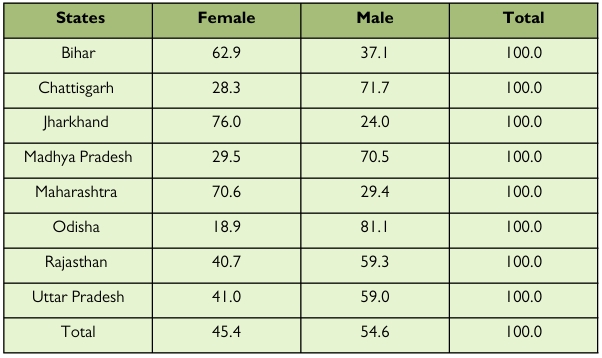
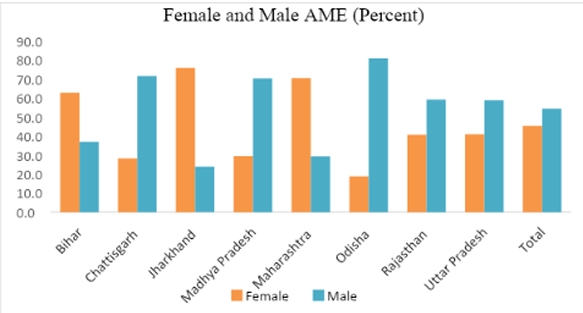
Figure 2: Female and Male AME in ASA (In Percent)
a) Looking into the women’s participation in this Project, a fair representation of women was seen (Table 4 and Figure 2) as female AME constituted 45.4 percent, and male AME comprised 54.6 percent of all the AME in the Project.
b) Jharkhand had the highest participation of female AME, and Odisha had the lowest.
Selection of Enterprise
As per a study by Ho, M. et al. (2018), “self-efficacy,” which is described as the self-confidence amongst entrepreneurs to be able to start and run a business, is a significant element in entrepreneurship, as the amount of effort they are willing to put in and their level of persistence are all influenced by their level of self-efficacy. Entrepreneurial self-efficacy is more predictive than general self-efficacy since it is domain-specific.
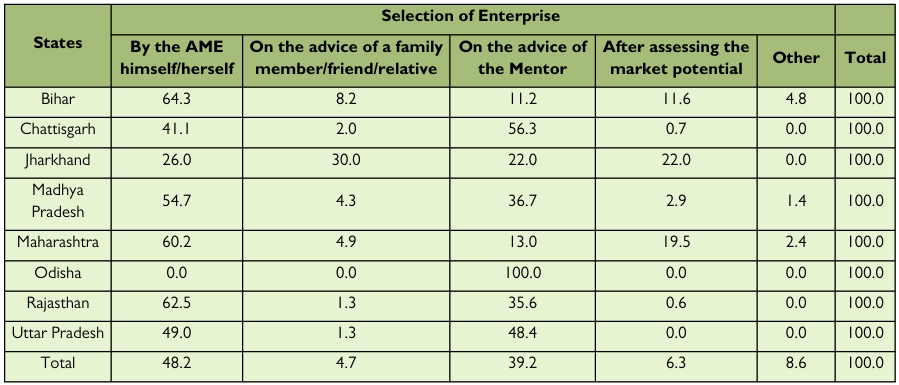
Table 5: Selection of Enterprise (In Percent)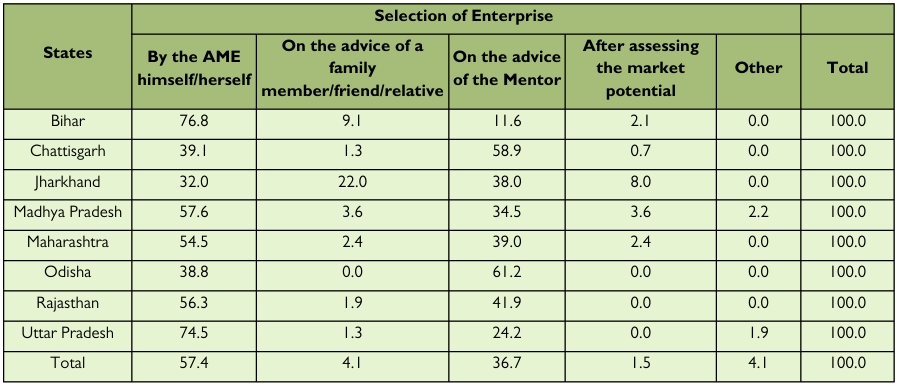
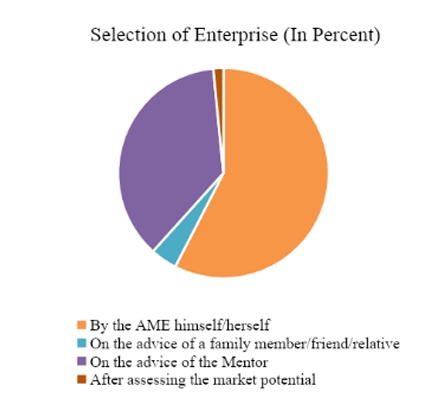
Figure 3 Selection of Enterprise (In Percent)
Self-reported efficacy in a person can be identified if they are able to identify the establishment and projection of their business ideas. A report by International Impact Evaluation (3ie, 2016), one of the important factors to consider when evaluating the ntrepreneurial program is whether participants are actively engaged in entrepreneurial activities in terms of their role in selecting and managing the business activities. Tables 5 reflects the data about the process of ‘selection of the enterprise’ and the process of finalization of the ‘location of enterprise’ in the ASA Project.
a) As could be seen from Table 5 and Figure 3; 36.7 percent of the AME had ‘selected the enterprise/activity’ on the advice of the Mentor. Odisha and Chhattisgarh were the states where more than half of the AME went by the guidance of Mentors.
b) 57.4 percent of the AME had ‘selected the location of enterprise’ by themselves, indicating therein that many of the AME had adequate confidence to decide upon the location of their business activity.
c) With reference to ‘self-identification of enterprises by AME’, amongst the eight states of the Project, Bihar reported the highest at 76.8 percent, followed by Uttar Pradesh. Jharkhand, with 32 percent, was the state with the relatively least proportion of AME who identified the enterprise on their own.
Selection of Enterprise Location
Table 6: Selection of Enterprise Location (In Percent)
a) When it came to the issue of selection of enterprise location, almost one-third of the AME selected the location of enterprises on the advice of the Mentor. It was interesting to note that all the AME in Chhattisgarh went by the guidance of Mentors. This probably indicated that the quality of mentorship provided was relatively the best amongst the eight states under study.
b) The overall scenario for the Project indicates that less than half of the AME had chosen the place of their enterprises on their own. This indicated that many of the AME had reasonable confidence and experience about the location to commence their business.
c) About 6.3 percent of AME had selected their enterprise location after assessing the ‘market potential’ in the area. This reflects that rural entrepreneurs probably need to be sensitized more on the issue of the significance of analyzing market potential.
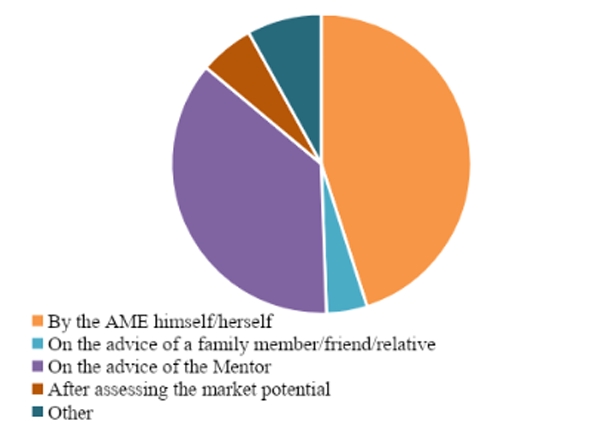
Figure 4: Selection of Enterprise Location (In Percent)
Generally, it is believed that women are less likely to identify themselves as entrepreneurs due to the dominantly masculine discourse surrounding entrepreneurship and societal stereotypes of entrepreneurship (Gupta et al., 2008; Ho et al., 2018). Ismail (2018) writes women discovered that having a basic understanding of business planning helped them set objectives for their businesses. In the ASA Project, the gender consideration in terms of the identification of enterprise is reflected in Table 7 and Figure 5.
Table 7: Gender-wise selection of Enterprise (In Percent)
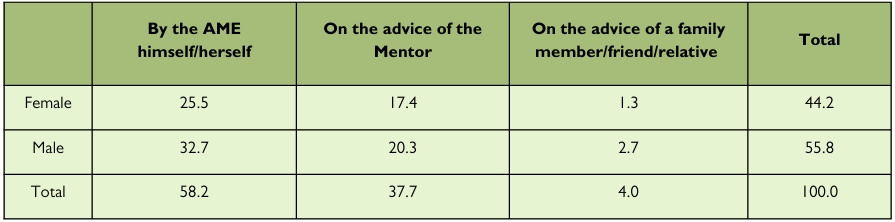
a) More than half of the responding AME had chosen their enterprises by themselves.
b) Of the total AME, about one-fourth were female AME who had made the selection of the enterprises by themselves.
c) And about 17% of female entrepreneurs went by the advice of the Mentor.
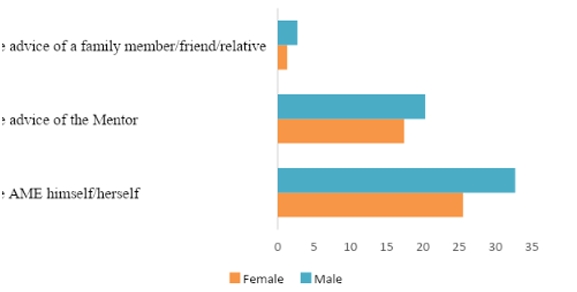
Figure 5: Gender-wise selection of Enterprise (In Percent)
Table 8: Location of Enterprises (In Percent)
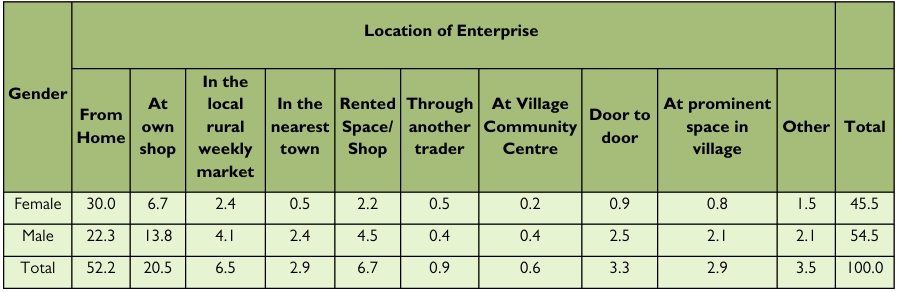
Table 8 reveals that more than half of the AME respondents had chosen their ‘home’ as the location for the commencement of their enterprises, followed by enterprises set up in their own shops and rented spaces. About one-third of the women AME had chosen ‘home’ as the primary location for their enterprises.
Source of Finance
The primary causes of poverty in India include not just a lack of possibilities but also a lack of knowledge on the accessibility of investment capital and a lack of self-confidence (Goel, G. and Rishi, M. 2011). Further, the authors wrote that Mohammad Yunus, the creator of the Grameen Bank, focused on giving microcredit to the landless poor so they could buy income-generating assets and improve their capacity to produce and trade. Yunus’s initiatives sparked a new ‘microcredit sector’ in underdeveloped nations and released a slew of businesses that assert to be eradicating poverty by making profitable loans to the underprivileged. Constraints on human capital may be important, particularly if having enough managerial capabilities is needed to access other resources, including financial services. There is a large number of ‘enterprise development services’ and ‘entrepreneurship training’ programs that are aimed at SMEs in low- and middle-income countries, but there is hardly any comprehensive research on their efficacy (Karlan, D. et al., 2014). Karlan et al conducted a study in four cities in Central Uganda to measure the success of the Women Mean Business (WMB) training program to determine how better ‘managerial human capital’ affects the financial success of entrepreneurs who receive training, as well as how such an intervention affects enterprises that work with and against them, where they found that despite owning 40 percent of businesses with registered premises, women obtain only 9 percent of all credit disbursed. Table 5.8 describes the various sources of credit that were considered for setting up the enterprises by the AME, along with their respective proportions utilized in this entrepreneurial activity (Table 9).
Table 9: State-wise breakdown of Sources of Finance (In Percent)
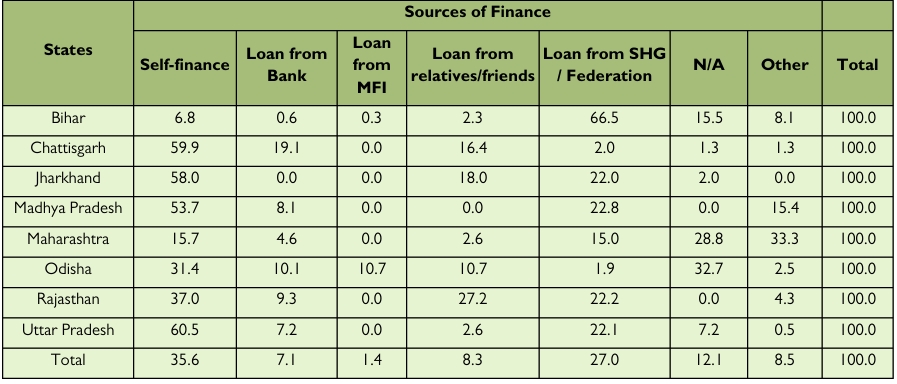
a) The majority (35.6 percent) of the AME, had ‘self-financed’ their enterprise.
b) The credit availed by the AME from MFI was found to be the least among the five sources of finance.
c) About three-fourths of the AME in Bihar had acquired loans through SHG/Federation. Indicating thereby that, probably, the outreach of SHG intervention is quite pronounced in the state, and women have been able to raise credit through this mode quite conveniently.
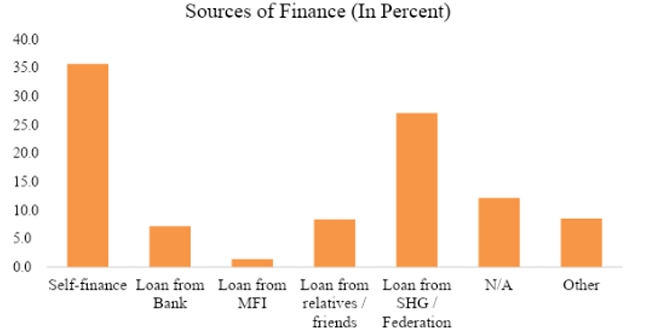
Figure 6: Sources of Finance (In Percent)
Table 10: Proportion of various Sources of Finance (In Percent)
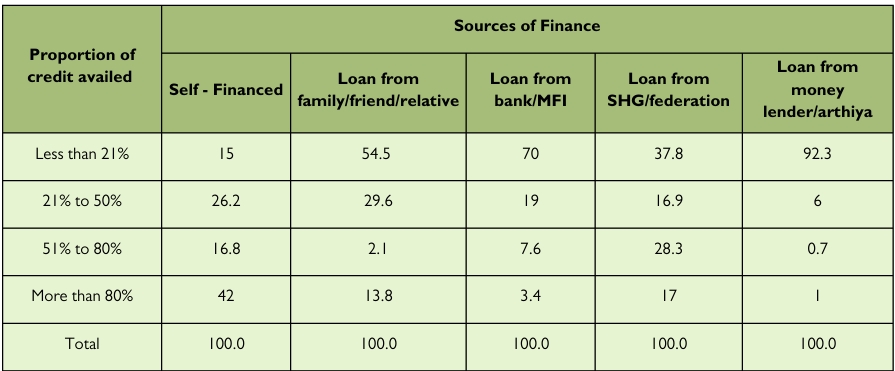
a)From Table 10 and Figure 7, it could be inferred that about 42 percent of the AME had contributed more than 80 percent of the total capital required for the establishment of their own enterprise.
b)More than half of the AME (54.5 percent) had taken less than 21 percent of the capital required to start their business operations as loans from their family/relatives/friends.
c)Seventy Percent of AME availed less than 21 percent of the total capital needed as loans from banks or MFI to commence their business.
d)8 percent of the AME acquired loans from SHGs or Federations to fund no less than 21 percent of their financial requirement for establishing their enterprise.
e)In the case of AME, who took a loan from a money lender/arthiya, 21 percent of the investment required for commencing the business was met in 92.3 percent of the AME.

Figure 7: Proportion of various Sources of Finance (In Percent)
Income of AME
Entrepreneurship functions as a beneficial driver in economic growth by serving for fast expansion and as a bridge between invention and marketplace, as well as improving national income by creating new jobs (Shreepad & Ahmed, 2016). Rural areas will undoubtedly experience economic progress thanks to entrepreneurial efforts. Increased demand for agricultural and non-agricultural sector goods and services will undoubtedly have a multiplier effect on rural incomes, increasing employment possibilities (ib id). To understand the effect of the decision by the AME in setting up the enterprise as well as the age of enterprise on their average monthly income, both the factors are cross-tabulated as presented in Table 11.
Table 11 Co-relation between Selecting Enterprise and Average Monthly Income of AME
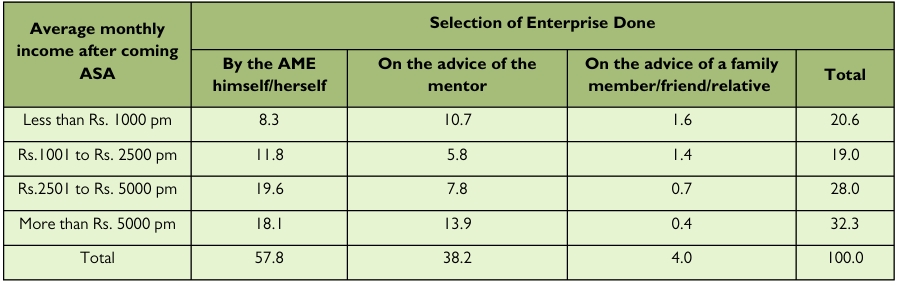
a) The data (Table 11) reveals that more than half of the respondents said that they had selected their enterprises by themselves.
b) Among those AME who had selected their enterprises by themselves, 19.6 percent of them were from the income category of Rs.2501 to Rs. 5000 per month.
c) On the other hand, of the AME who followed their Mentor’s advice for selecting the enterprise activity, 13.9 percent of them earned more than Rs. 5000 per month.
d) Among AME who went by their family members’/friends’ guidance, 1.6 percent of them earned less than Rs. 1000 per month.
Table 12: Co-relation between Age of Enterprise and Monthly Income of AME
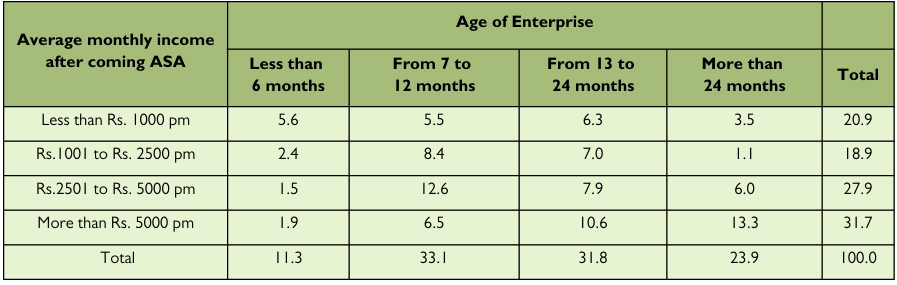
a) The data in Table 12 provides a breakdown of the average income of the AME in relation to the age of their respective enterprises. It can be inferred that, with the increase in the age of their enterprises, there is an appreciation in the monthly income of AME. Thus there is a direct proportion between the age of the enterprise and the income levels (Figure 8)
b) The data further revealed that 31.7 percent of the AME earned more than Rs. 5,000 per month. Out of which, 12.9 percent have had their enterprises running for more than 24 months, 10.6 percent had their enterprises operating for 13 to 24 months, 6.5 percent had their enterprises in business for 7 to 12 months, and 1.7 percent had their enterprise age of fewer than 12 months.
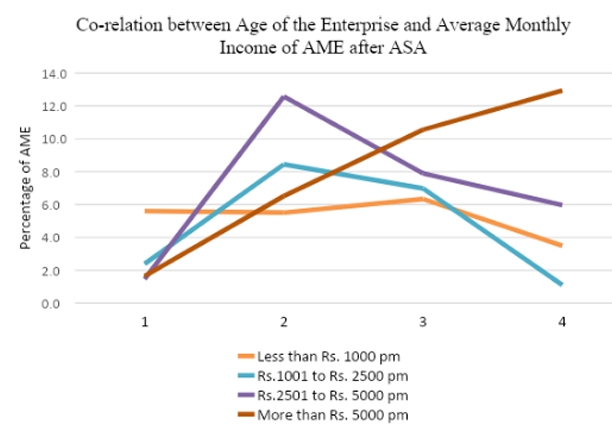
Figure 8: Co-relation between Age of the Enterprise and Monthly Income of AME after ASA
Table 13: Comparison of monthly income before and after coming into fold of ASA
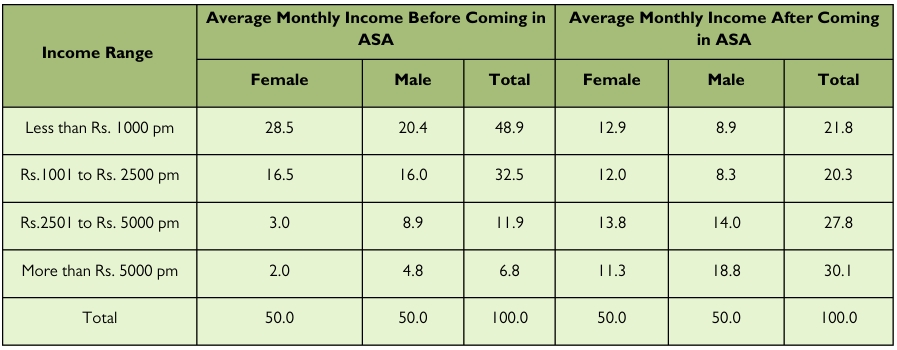
a) A closer inspection of the data in Table 13 shows that before the commencement of ASA, nearly half of the AME population had an income of less than Rs. 1000 per month. As the Project went along, it was seen that the number of AME earning less than Rs. 1000 per month fell by nearly half after the ASA project. Thus, it could be concluded that the incomes of AME in the lowest slab of income (in the study) had decisively improved after coming into the ASA fold.
b) Furthermore, the number of AME earning more than Rs. 5000 per month before the ASA increased to almost four times after the ASA intervention. Thus, it could be inferred that the income of AME in the highest slab of income (in the study) had substantially improved after coming into the ASA fold.
c) An increase of income by 9.3 percent in female AME (in the slab of earning more than Rs. 5,000) was observed after they came under the ASA Project. These findings are corroborated by other research studies that were done using surveys or administrative data (Baliga, V. et al., 2021; Sathya, 2019), where an increase in the income of women in entrepreneurship was observed.
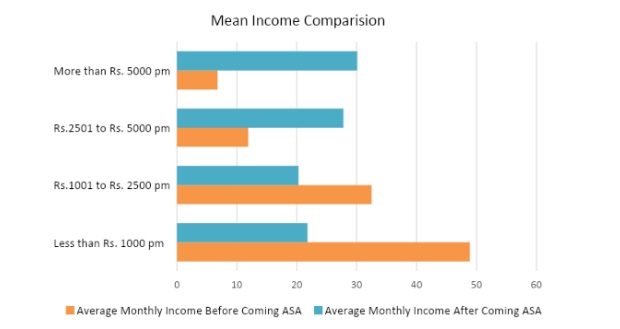
Figure 9: Comparison of Mean Income of AME before and after ASA
Challenges faced by AME in establishing their Enterprises
The success of rural entrepreneurs is hampered by a number of factors, including the availability of adequate and timely credit, vocational skills, technology, management of books of accounts, marketing, societal restrictions, etc., and the challenges become more severe, specifically for women. The constraints (as studied in the Project) faced by the AME for their enterprise activity have been listed in Table 14.
Table 14: Consolidated Gender-wise constraints (In Percent)
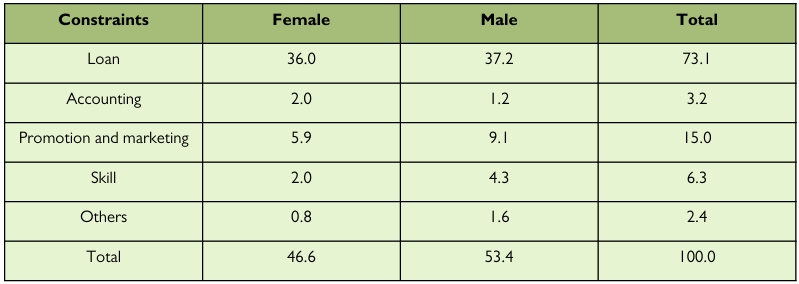
a) In the ASA Project, access to loans for their enterprises had been one of the major constraints (73.1 percent), with the highest loan constraint reported in Rajasthan (89.4 percent) and the lowest reported in Maharashtra (31.7 percent). This is corroborated by a similar study conducted by Manikandan, 2022, where he concluded that for aspiring business owners, specifically in rural areas, obtaining a loan is a significant barrier.
b) As evident from Table 5.13, no cases of gender-specific challenges were seen in the ASA Project. It is to be noted that the lack of access to credit had been a constraint in the Project irrespective of gender, i.e., both men and women have faced a paucity of funds, at 36 percent and 37.2 percent, respectively. Similar findings were stated by Manikandan (2022) and Tanwar and Bhardwaj (2022); due to a lack of tangible security and credit in the market, the majority of rural businesses struggle to obtain outside funding.
c) The second-biggest (15 percent) challenge that AME faced in the running of their enterprises was the promotion and marketing of their enterprises. Most often, rural business owners struggle with marketing challenges, including a lack of market knowledge as they struggle to understand the current market trends since consumer tastes, preferences, and fashion change daily, which results in a loss of markets and clients (Suma and Hemalatha, 2022). In a study by Tanwar and Bhardwaj (2022), the cost of promotional efforts was often not considered, as there wasn’t a significant financial outlay for marketing initiatives
Significance of ASA in the livelihoods of AME
Through the development of economic entities, entrepreneurs create wealth by diverting resources away from less productive uses and towards more productive ones and serve as catalysts for economic development and as agents of social transformation and change by making efficient and effective use of the resources available to the country (Ch Das Asst, 2014).
Under the ASA Project, AME has been receiving constant guidance from the Mentors. It is obvious that appreciation in income levels was not the only benefit accrued by AME. Many other tangible and non-tangible benefits percolated to AME of the ASA Project. Tables 15 and 16 attempt to depict the ‘indirect benefits’ received by AME.
Table 15 Co-relation between Sources of Finance and Enterprise Status (In Percent)
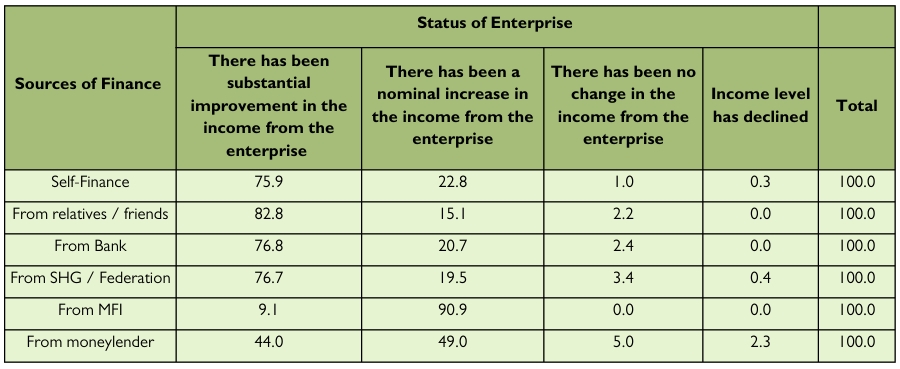
a) It could be observed from Table 15 that 75.9 percent of AME, who had pooled their own money for the establishment of business, stated to have substantial improvements in the income from their enterprise. At the same time, none of the self-financed AME reported a decline in their income.
b) Only 2 percent of AME, who had invested in their enterprises through loans from the moneylender, reported a decline.
c) For investments made through loans from MFIs, the majority (90.9 percent) stated to have got a nominal increase in their incomes.
d) However, when it came to raising financial resources from relatives, banks, and SHGs/Federations, a good proportion of AME reported a significant increase in the income from their enterprises.
Table 16: State-wise reported benefits of ASA
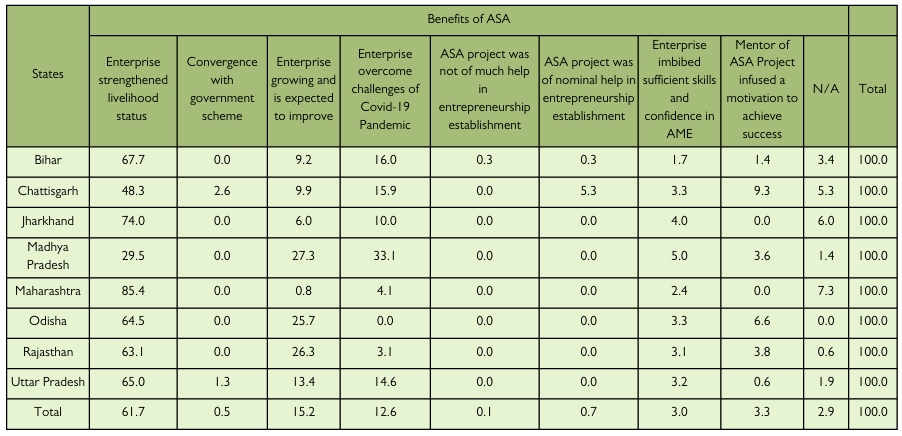
a) More than half of the AME (61.7 percent) stated to have ‘strengthened their livelihood status’ through the ASA Project (Table 16). Such observations are supported by various other studies, including those of Eze et al. (2012); Ismail (2018); Sumathy and Velmurugan (2019); and Suma and Hemalatha (2022), which show that rural entrepreneurs play an important role in the standard of living improvement, and balanced regional development.
b) The highest proportion of AME who claimed to have ‘strengthened their livelihoods’ was in Maharashtra (85.4 percent), and the lowest was in Madhya Pradesh (29.5 percent).
c) The highest number of AME reporting that their enterprise was ‘growing gradually’ was in Madhya Pradesh (27.3 percent), followed by those from Rajasthan (26.3 percent).
d) 6 percent of the AME in the ASA Project claimed that they could ‘overcome the challenge of the COVID-19 pandemic’ with confidence due to the ASA Project.
e) About 3.3 percent of AME proclaimed to have been significantly ‘motivated’ for success due to ASA Project.
Table 17: Status of the Enterprises with respect to their Locations (In Percent)
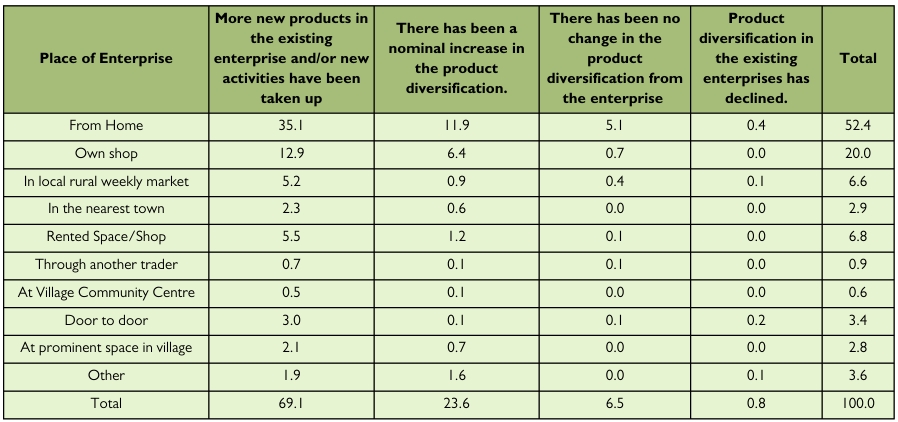
- About one-third of the total AME had stated that they had undertaken product diversification to the existing enterprise. This was most pronounced in the case of the AME doing business from their home.
- A minuscule proportion of AME (0.2 percent) responded that their enterprise’s product diversification had declined.
- 9 percent of the AME who opted to start their enterprise at their own shop were able to take up more ‘new products and/or new activities’ in their existing enterprises.
Table 18: Gender-wise breakdown of Enterprises’ Activity (In Percent)
| Activity chosen | Female | Male | Total |
| Kirana Shop | 6.3 | 12.1 | 18.4 |
| Cyber Café | 0.7 | 2.6 | 3.2 |
| Vegetable Cultivation | 3.4 | 5.5 | 8.9 |
| Tailoring | 8.8 | 1.4 | 10.1 |
| Buffalo | 1.4 | 2.4 | 3.7 |
| Goat rearing | 8.1 | 4.3 | 12.4 |
| Poultry | 1.5 | 2.3 | 3.7 |
| Trading of Clothes/garments | 1.7 | 1.6 | 3.2 |
| Mushroom cultivation | 0.6 | 0.4 | 1.0 |
| Cow | 3.1 | 1.3 | 4.4 |
| Other | 9.6 | 21.1 | 30.8 |
| Total | 45.1 | 54.9 | 100.0 |
Table 18 and Figure 10 present the types of enterprises taken up by the AME under the Project. The highest number of enterprises established by AME was kirana shops (grocery shops) at 18.4 percent, followed by goat rearing (12.4 percent) and tailoring (10.1 percent). The category ‘other’ enterprises include – spice making, furniture, flower cultivation, pottery, photography, trading of jute items, mechanics, fish farming, etc., are included in the
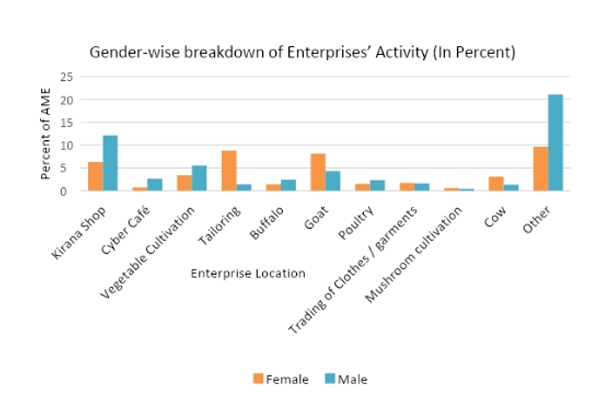
Figure 10: Gender-wise breakdown of Enterprises’ Activity (In Percent)
Inferential Statistical Correlations
Statistical tests were used to determine the relationships between the different variables. The results of the test are displayed in Table 19.
Table 19: Summary of the Statistical Test Results
| Variables | Null Hypothesis | p-value | Result | Inference |
| Selection of Enterprise and Gender | The distribution of enterprise chosen is the same across categories of gender. | .790 | Accept the null hypothesis. | No statistically significant relationship was found between Gender and Choice of Enterprise |
| Average Monthly Income after ASA and Gender | The distribution of Average Monthly Income After Coming ASA is the same across categories of gender. | .000 | Reject the null hypothesis. | Significant relationship was present in the Gender of AME and their Monthly Income after ASA |
| Status of Enterprise after ASA and Way of Selection of Enterprise | The Status of Enterprise is the same across categories of Enterprise Selection | .001 | Reject the null hypothesis. | Significant relationship was present in the Status of Enterprise after ASA and Way of Selection of Enterprise |
| Source of Finance and Diversification of Enterprise of AME | The distribution of Diversification of Enterprise is the same across categories of Sources of Finance | .000 | Reject the null hypothesis. | Significant relationship was present in the Source of Finance and Diversification of enterprise of AME |
| Constraints Average Income of AME after ASA | The distribution of Constraints faced by AME is the same across categories of Monthly Income of AME | .566 | Accept the null hypothesis. | No statistically significant relationship was found between Constraints faced by AME and Average Income of AME after ASA |
| Average Monthly Income and Selection of Enterprise
|
The distribution of Monthly Income of AME is the same across categories of Selection of Enterprise | .070 | Accept the null hypothesis. | No statistically significant relationship was found between Average Monthly Income of AME and Selection of Enterprise
|
| Average Monthly Income and Selection of Location of Enterprise
|
The distribution of Monthly Income of AME is the same across categories of Selection of Location of Enterprise | .007 | Reject the null hypothesis |
Significant relationship was present in the Average Monthly Income of AME and Selection of Location of Enterprises
|
- When the test of significance was conducted on the two dependent variables (i.e., an activity chosen and average income per month after ASA), controlling for gender, at a significance level of 0.05, the following inferences were deduced:
a) It was found that no statistically significant association was present between the female AME and their choice of enterprise, which implied that the AME had selected the activity for their enterprise irrespective of their gender.
b) However, a significant relationship was found between the gender of AME and their average monthly income after the ASA Project.
- After testing the presence of a significant association between the status of AME of overall sales after coming into the fold of ASA and selection of enterprise, a significant association was found between the factor variables as the significance score was less than 0.05. This meant that the AME who had selected their enterprises by themselves were more likely to have positive results in their enterprise.
- A test of significance between the source of finance and diversification of enterprise of AME was conducted. It was seen that a significant association was found between the two variables, which implied that the diversification of the enterprises was not independent of the sources of finance. AME, who had self-financed their enterprise, was able to diversify more in their work.
- The Mann-Whitney U test was used to evaluate the data in order to determine the effect of constraints on the average monthly income of the AME after coming into the fold of ASA. It was observed that no significant effect was present between the two variables, implying that the constraints faced by the AME had no significant impact on their income from the enterprises.
- A Two-way ANOVA test was used to check the relationship between the monthly income of AME and their ‘selection of enterprise’. The findings revealed that enterprise selection had no significant impact on their average monthly income
- Similarly, a two-way ANOVA test was used to determine the association between the monthly income of AME and their ‘selection of the location’ of their enterprises. A statistically significant relationship was found between enterprise location selection and the average monthly income. Thus it could be interpreted that the AME who chose the location of their enterprises on their own had a higher monthly income.
Feedback by AME
When evaluating the success of any company or enterprise, economic metrics, including earnings, sales, profit, and inventories as current assets, are used. The substrata of entrepreneurship training programs can be the larger economic characteristics, including income, savings, profit, borrowing access, and asset ownership (Baliga, V. et al., 2021). The AME were asked to submit their feedback based on how they saw their enterprises evolving throughout the intervention. The responses are presented in Figure 11 and Table 20.
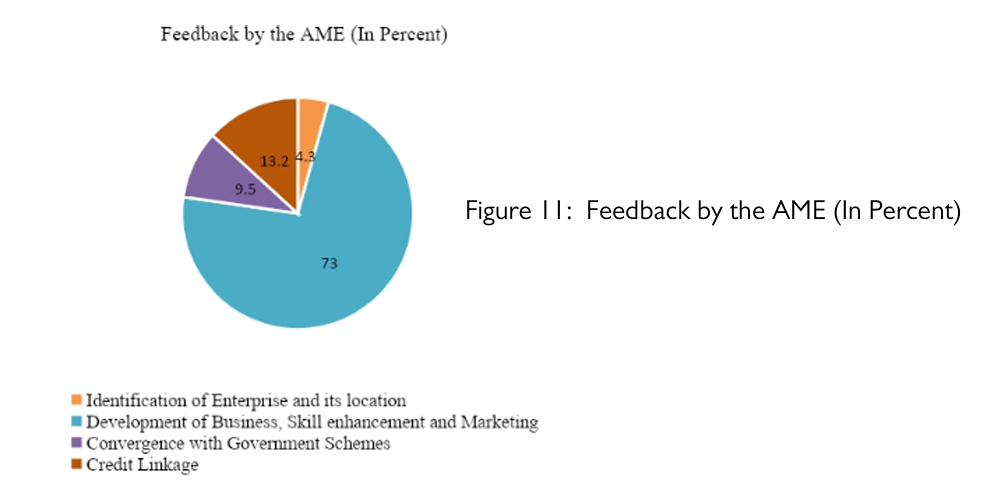
i) It was noted that about three-fourths (73%) of the AME felt that through the ASA Project, they received proper guidance from their ‘Mentors’ on the development of enterprise, skill enhancement, and marketing, which enabled them to develop their enterprise properly.
Table 20: Feedback by the AME (In Percent)
| Feedback | Percent |
| Identification of Enterprise and its location | 4.3 |
| Development of Enterprise, Skill enhancement, and Marketing | 73.0 |
| Convergence with Government Schemes | 9.5 |
| Credit Linkage | 13.2 |
| Total | 100 |
ii) About 13.2 percent of respondents reported that the Mentors specifically helped them in credit linkage with various financial sources.
iii) Approximately 9.5 percent of AME claimed to have benefited from convergence with government programs. AME would not have known about this otherwise. The Mentors guided and ushered the AME to benefit from relevant government policies, which aided the AME in strengthening their livelihoods.
iv) The appropriate selection of the business activity and its location were critical aspects of this intervention. About 4.3 percent of AME respondents said they were guided meticulously on these aspects.