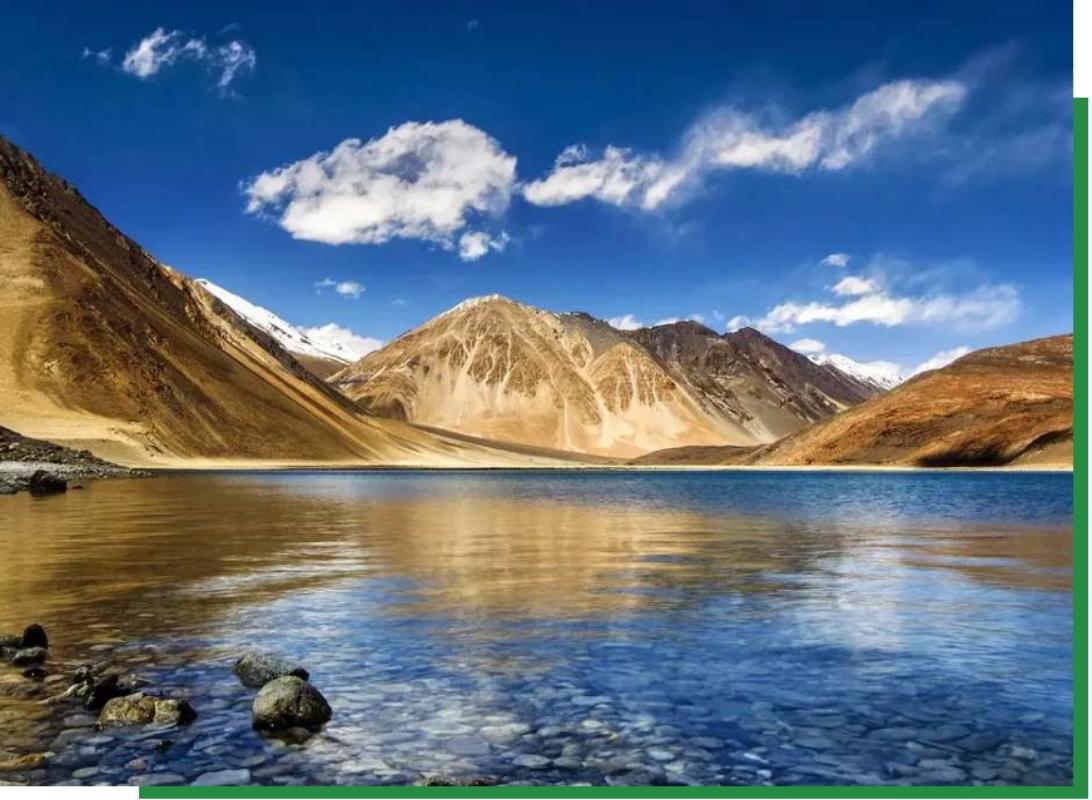
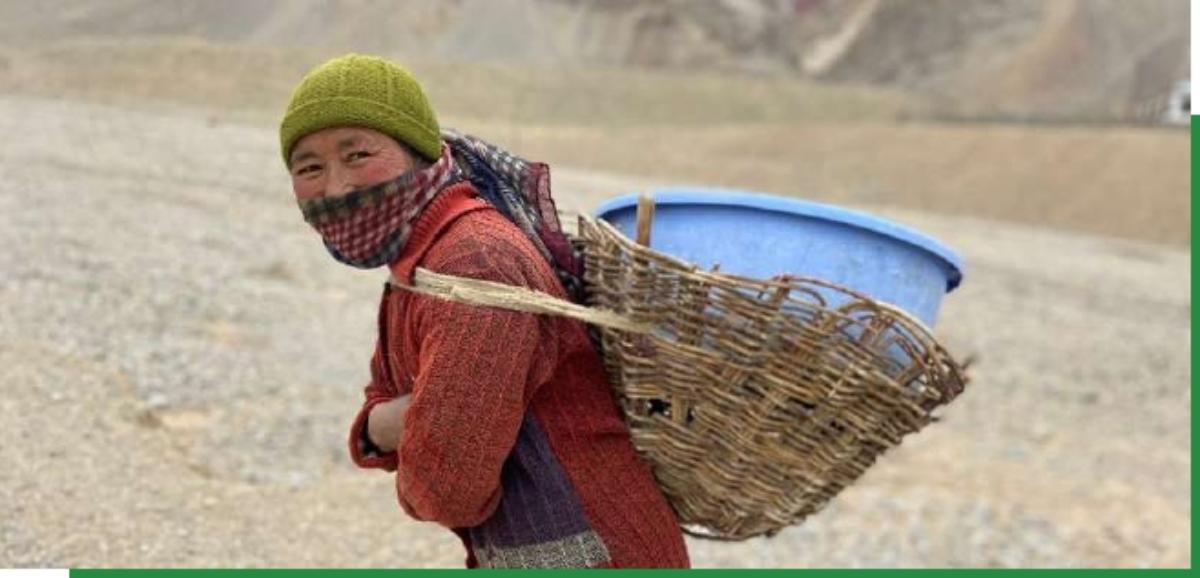
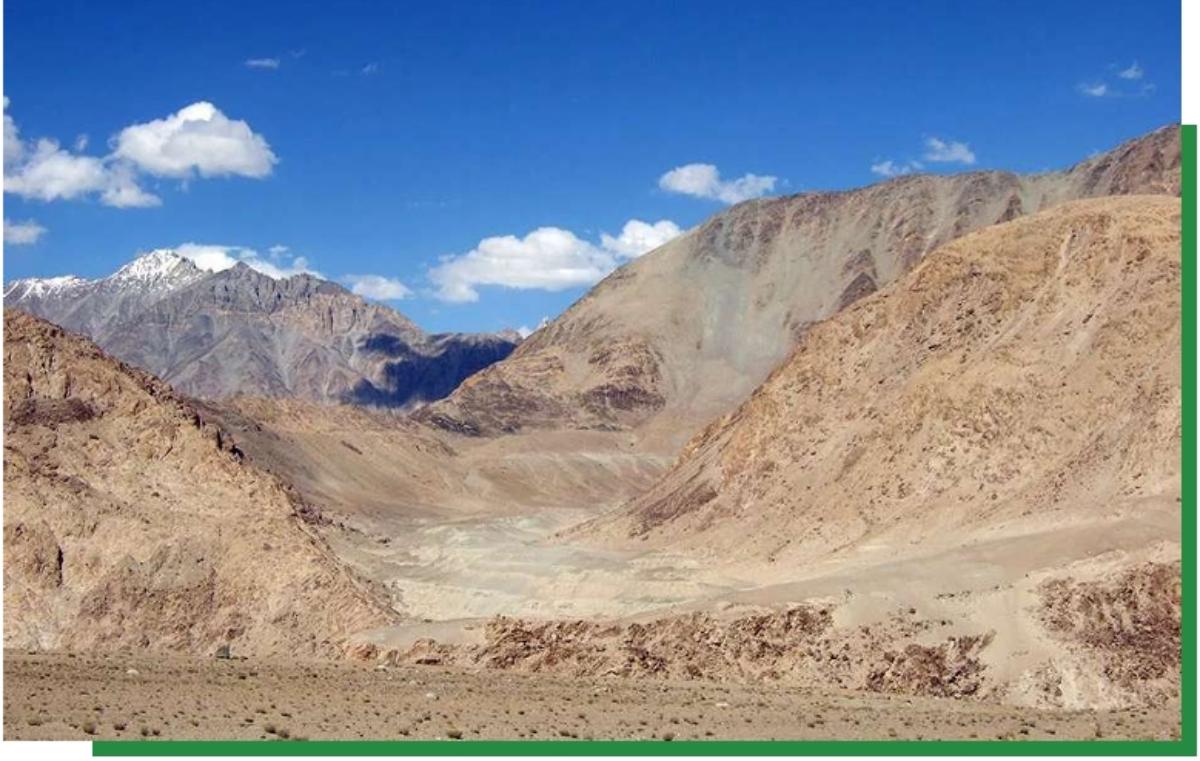
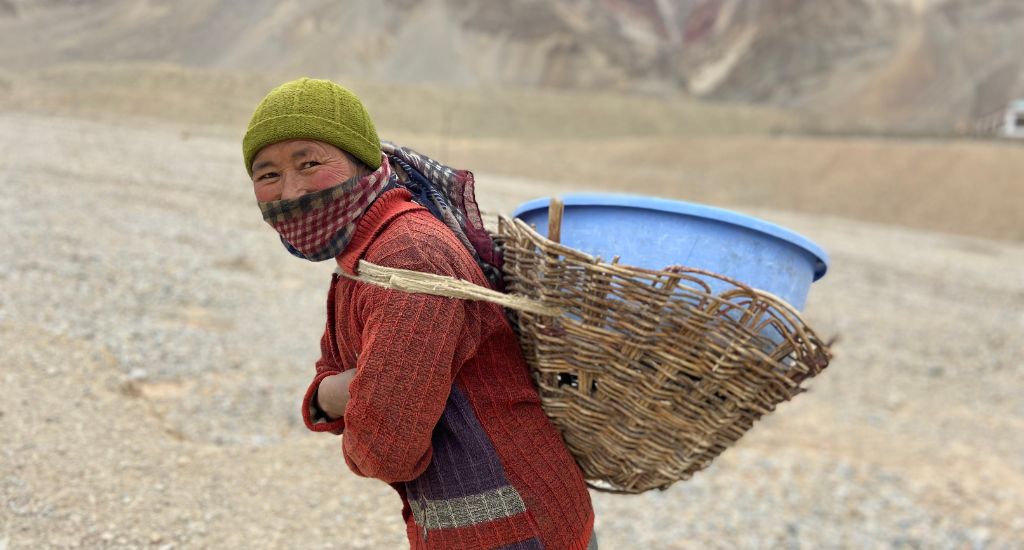
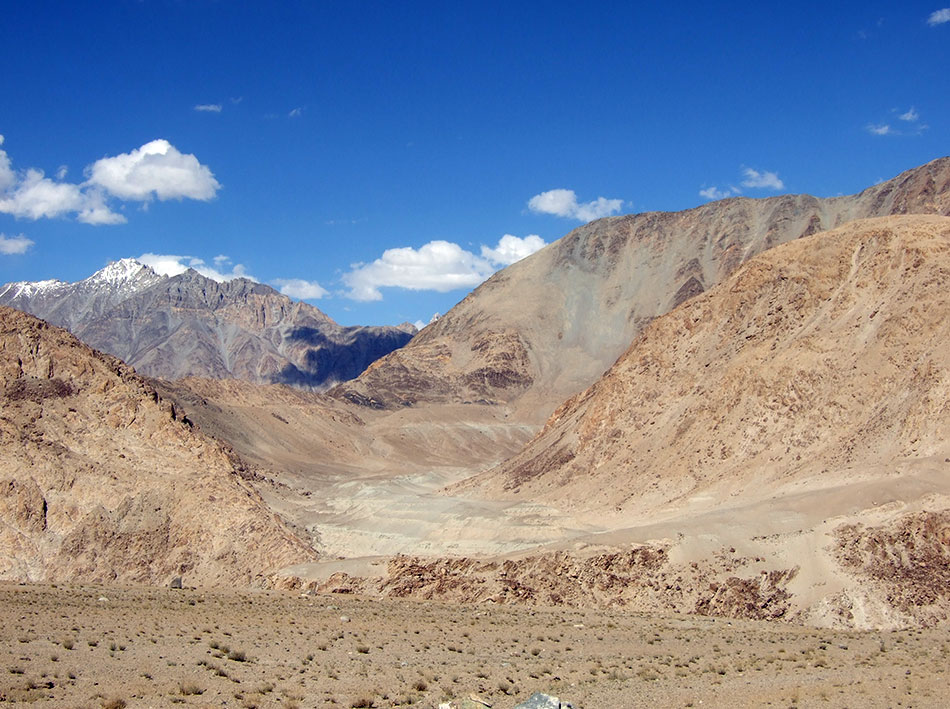
Of the two states and two Union Territories in the Western Indian Himalayan region, Ladakh has the largest geographical area. Comparing the natural environment of Ladakh with other three States and UT, it is very different and unique in the entire Himalayan region. The very cold and dry climatic condition of Ladakh due to its location in the region makes it a cold desert with very less vegetation, dearth of water resources and un-fertile soil. Despite this, the unique ecosystem of Ladakh supports the lives of more than three lakh population of the region and invaluable wildlife such as snow leopard, Kiang, Blue Sheep and Ladakh Urial.
Glaciers have been the lifeline of people and wildlife in Ladakh as snowmelt water feeds their streams and rivers. However, due various natural and anthropogenic factors, glaciers are melting at a faster rate leading to social, economic and ecological imbalance in the region. This chapter briefly highlights the state of the natural environment of Ladakh, especially the state of forest, soil, water and climate.
Jal – State of Water Resources
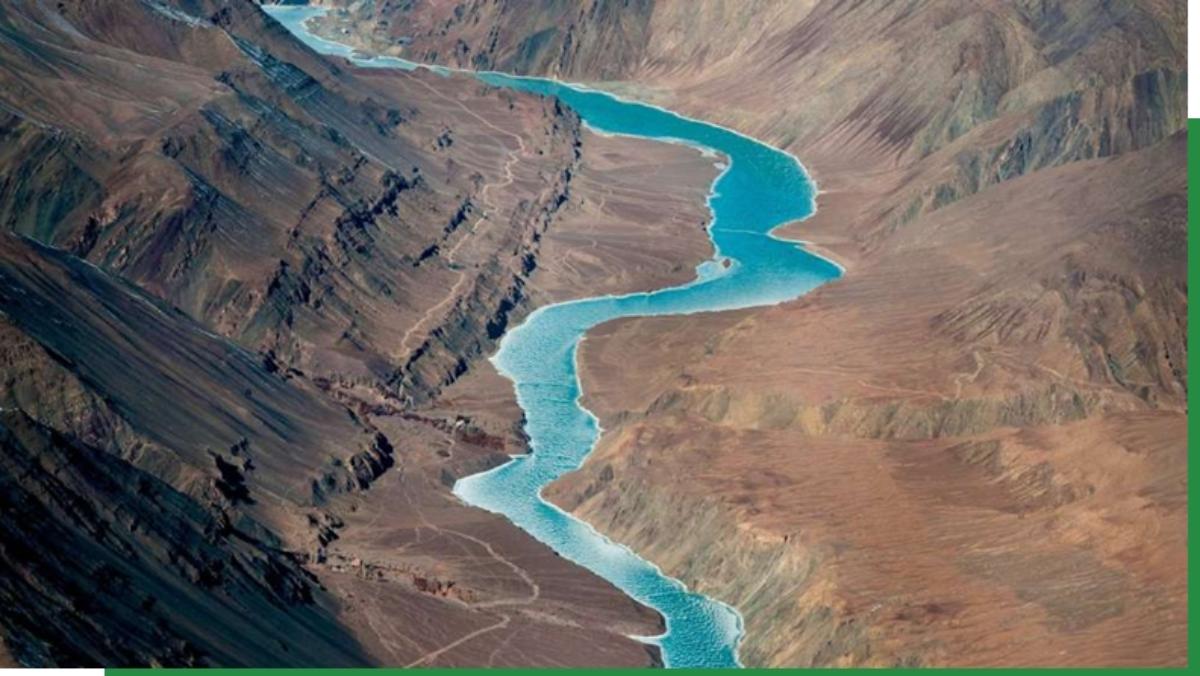
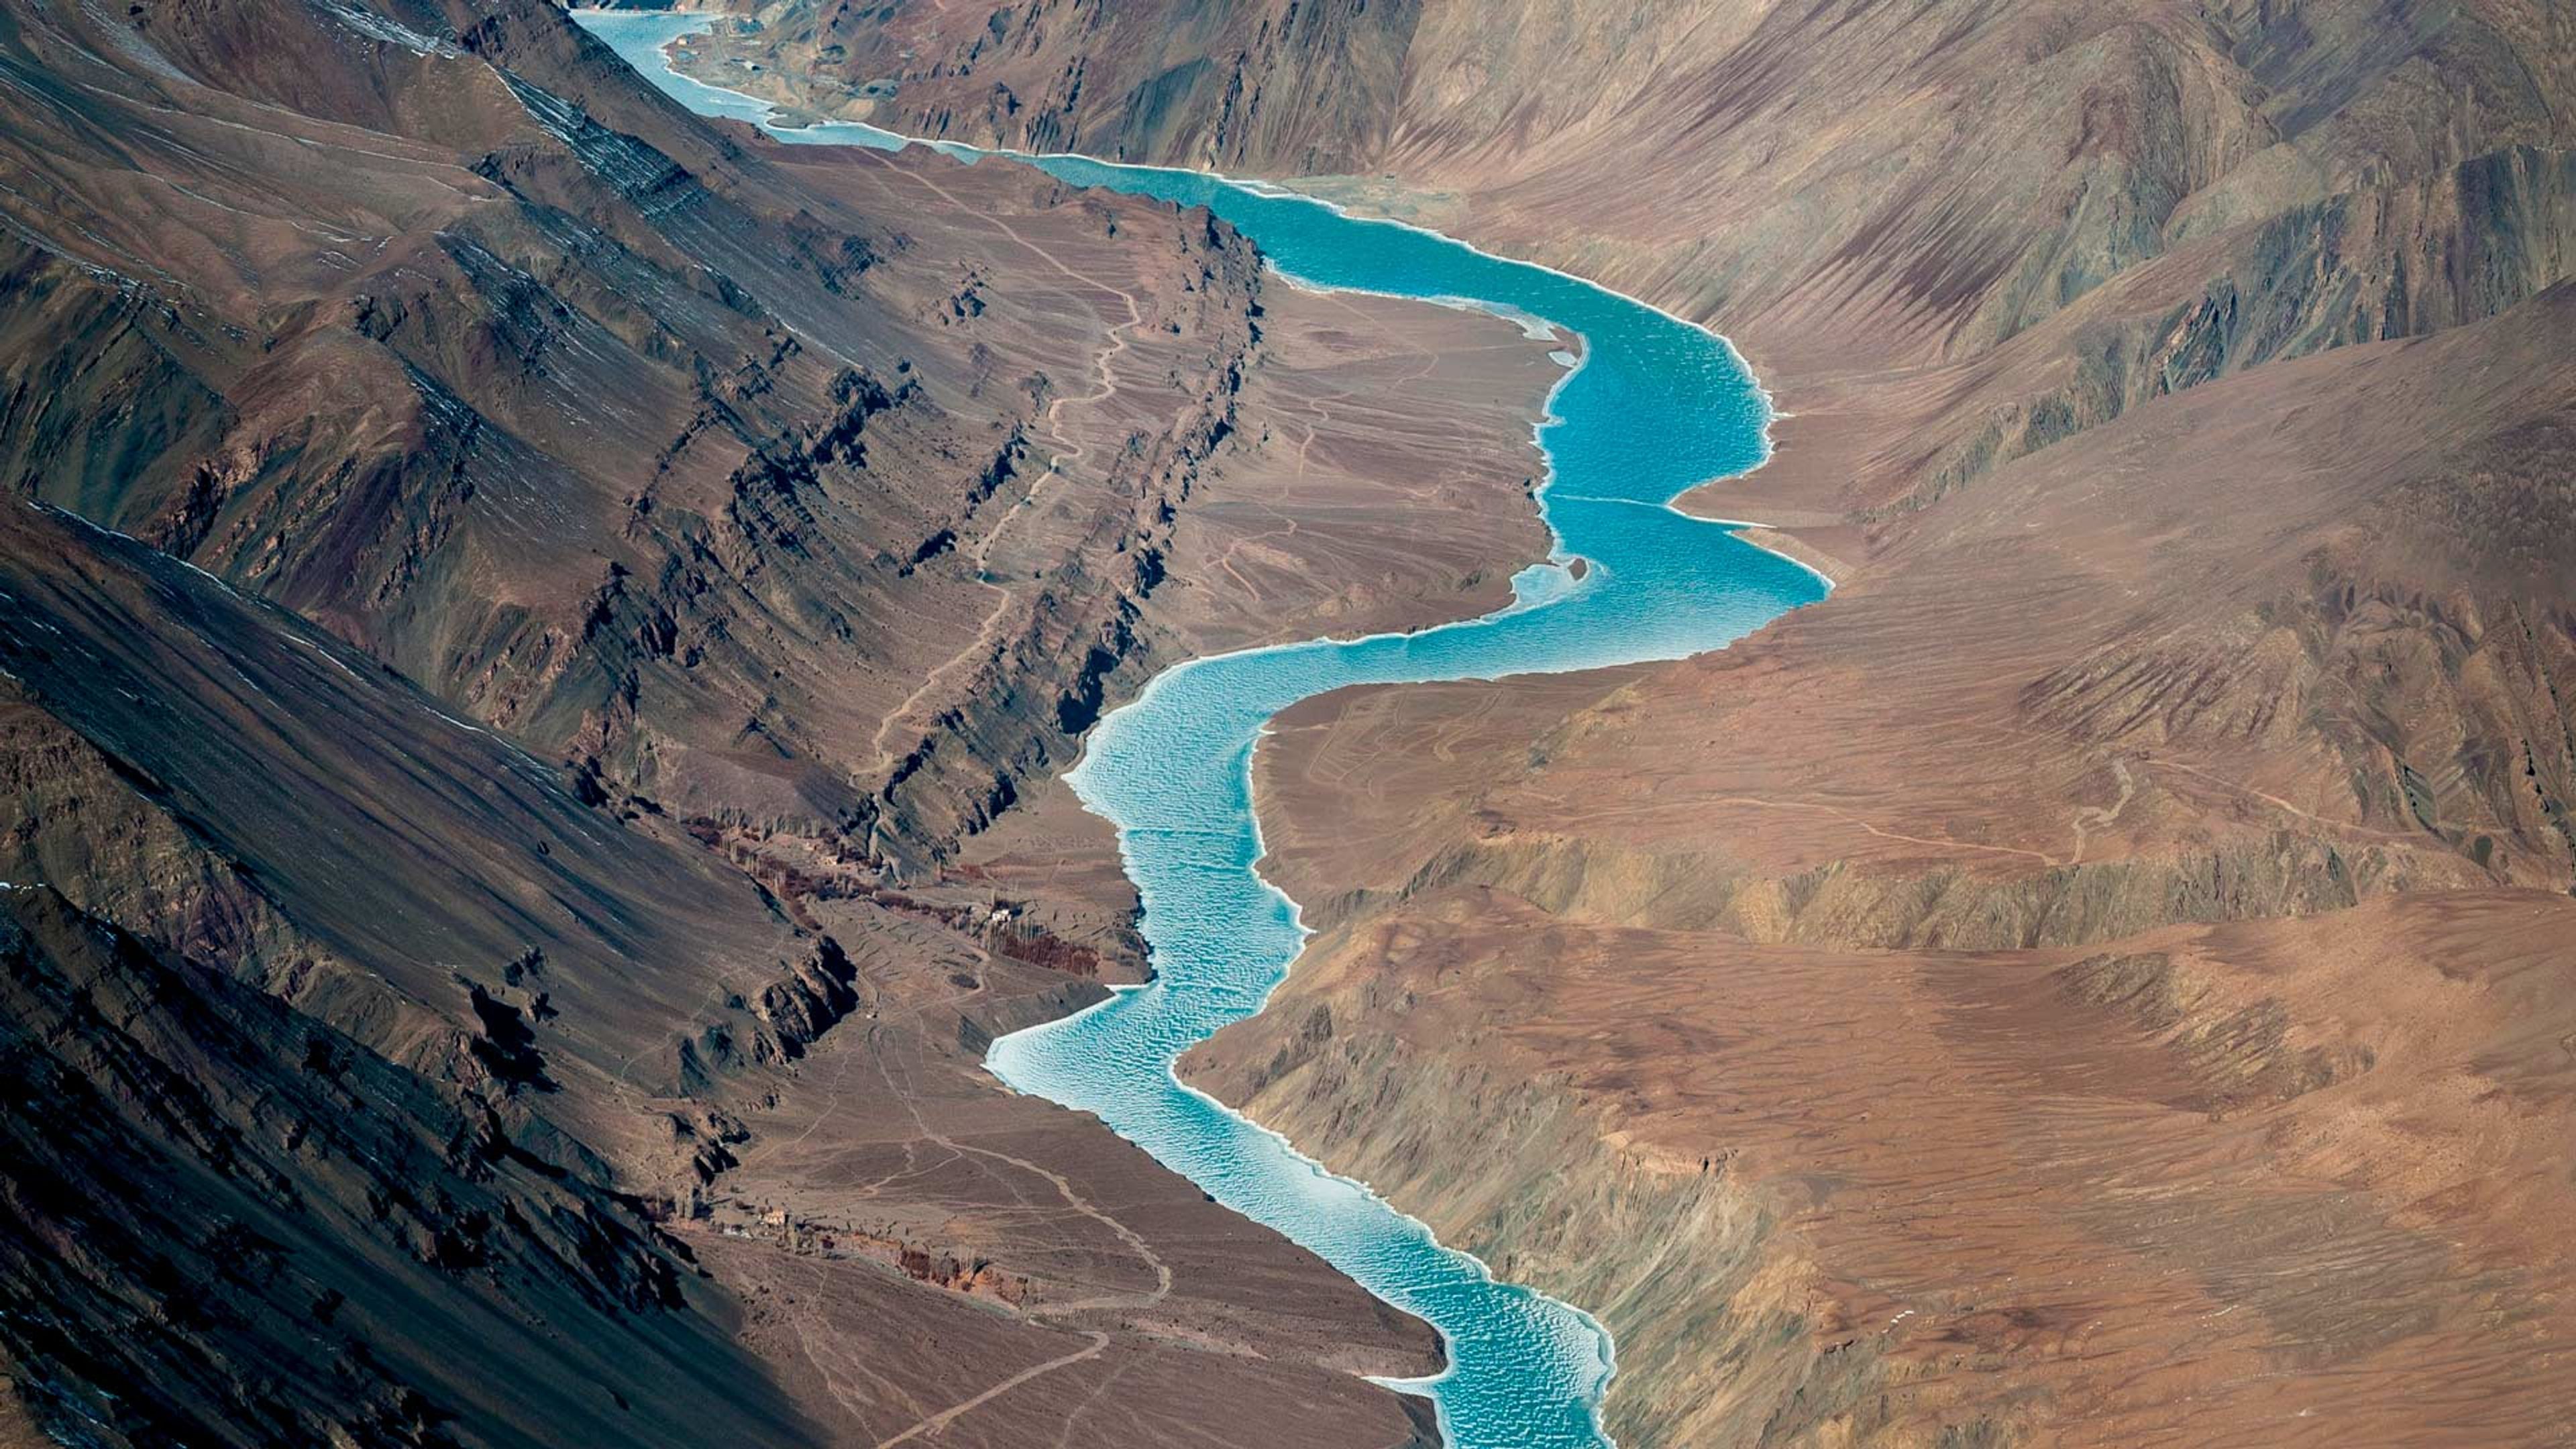
The most part of Ladakh drains in the Indus river basin except a small portion of its extreme north that drains towards Tibet. The total geographical area of the Indus river basin is about 3.21 lakh sq.km of which Ladakh shares nearly 80,000 sq. km. Indus is the main river in Ladakh that originates from Mansarovar lake in Tibet and covers a distance of nearly 801 km in India before entering in Pakistan[1]. It enters in Leh flowing northwest and passes important towns of the UT such as Nyoma, Upshi and Leh. While its course in Ladakh it meets thousands of small rivers, streams and nallas. Major rivers in the UT merge with Indus are Zansksr river, Shyok, Suru and Nubra. All these major contributories of the Indus in Ladakh are perennial rivers originating from different glaciers.
Shyok is the second longest river in Ladakh that originates from Depsang and passes through the north western part of Ladakh for about 280km. Gilgit and Shigar are another two rivers in the north and north western Ladakh. Shigar (south), Zaskar and Hanle are major left bank tributaries of Indus in the UT.
For a very large part of the northern and north western part of Ladakh, data is not available due to disputes on internal boundaries. Yet, as per central water commission, the area of Ladakh under the Indus basin is sub-divided into three sub basins. These are Gilgit sub basin, Shyok sub basin and Indus upper sub basin[2]. The Upper Indus sub-basin is largely located in Ladakh but also covers areas of Himachal Pradesh. It is the largest sub-basin in Ladakh with 46,450 sq km area. Indus river is the main river in this sub basin. The Shyok river forms another sub-basin in Ladakh. Its total geographical area is 38,545 sq km and falls entirely in Ladakh UT. The third sub basin of the Indus river basin is Gilgit sub basin. Gilgit sub basin is very large and spread in the area of Jammu & Kashmir and Ladakh. The total geographical area of Gilgit sub basin is 27,088 sq km. Major rivers of this sub basin are Gilgit and Huza.
Table 1: Major Water Statistics of Jammu and Kashmir
| Number of major river catchments | Number | 3 |
| Number of Glaciers | Number | 2257 |
| Watersheds | Number | 160 |
| Average annual Rainfall | MM | 210 |
| Number of lakes and water bodies | Number | 665 |
| Water Demand | Lakh Gallons/Day | 63 |
| Actual water supply | Lakh Gallons/Day | 39 |
Source: compiled from different Govt sources
The upper Indus sub basin has 70 watersheds of different sizes between 383 sq km to 974 sq km. Shyok sub basin has 53 watersheds and Gilgit sub basin has 37 watersheds. The Indus river basin feeds water to nearly five crore Indians of different states and UT. Of the total geographical area of the basin nearly 60% lies in Jammu & Kashmir and Ladakh. While the total annual average water potential of the basin is 73 BCM, it is disproportionately distributed across regions. Despite sharing the largest and mass of the Indus river basin in India, Ladakh has high water scarcity. Such scarcity of water in the UT is because of its unique geography, cold desert, low level of vegetation and very low level of precipitation.
Both districts of Ladakh namely Leh and Kargil are very dry and receive very less rain. The annual average rainfall in Ladakh is just 210 mm. Unlike in other parts of western Himalayan region, the precipitation in Ladakh is uniformly distributed across three seasons – pre-monsoon, south-west monsoon and winter. Ladakh receives nearly 90% of rain in these three seasons. Only 10% of the total rainfall it receives in the post-monsoon season. Kargil receives more rainfall compared to Leh district. The average annual rainfall in Kargil is 320 mm, whereas the annual precipitation in Leh district is just 97mm[3]. Average annual rainy days in Kargil are around 26 days compared to just 11 days in Leh districts.
The very little rainfall in Ladakh makes it dry and desert leading to shortage of water for drinking and agricultural activities. Further the region is also not very conducive for groundwater recharge. According to the Central Ground Water Board, the UT has only 965 sq km area worthy for ground water recharge. As per CGWB, “Ground water in Leh district occurs in porous formations that include moraines and fluvio-glacial deposits of Ladakh. Ground water in Kargil District occurs in the porous formation.”
The annual ground water recharge has decreased in the last few years from 0.12 BCM in 2020 to 0.09 BCM in 2023. However, the data shows that the annual groundwater extraction has increased from 0.02 BCM in 2020 to 0.03 BCM in 2022 and 2023. Alarmingly, the stage of ground water extraction is increasing in the UT. It increased from 17.9% in 2020 to 41.36% in 20222. However, it observed marginal decreased in 2023[4]. The extraction of groundwater in Ladakh is mainly for domestic purpose apart from very little for industrial purpose (0.0002 BCM)[5].
Table 2: Ground Water Recharge and Extraction in Ladakh
| Attribute | GWRA 2020 | GWRA 2022 | GWRA 2023 |
| Total Annual Ground Water Recharge (bcm) | 0.12 | 0.08 | 0.09 |
| Annual Extractable Ground Water Resources (bcm) | 0.11 | 0.07 | 0.08 |
| Annual Ground Water Extraction (bcm) | 0.02 | 0.03 | 0.03 |
| Stage of Ground Water Extraction (%) | 17.90 | 41.36 | 37.05 |
Source: CGWB
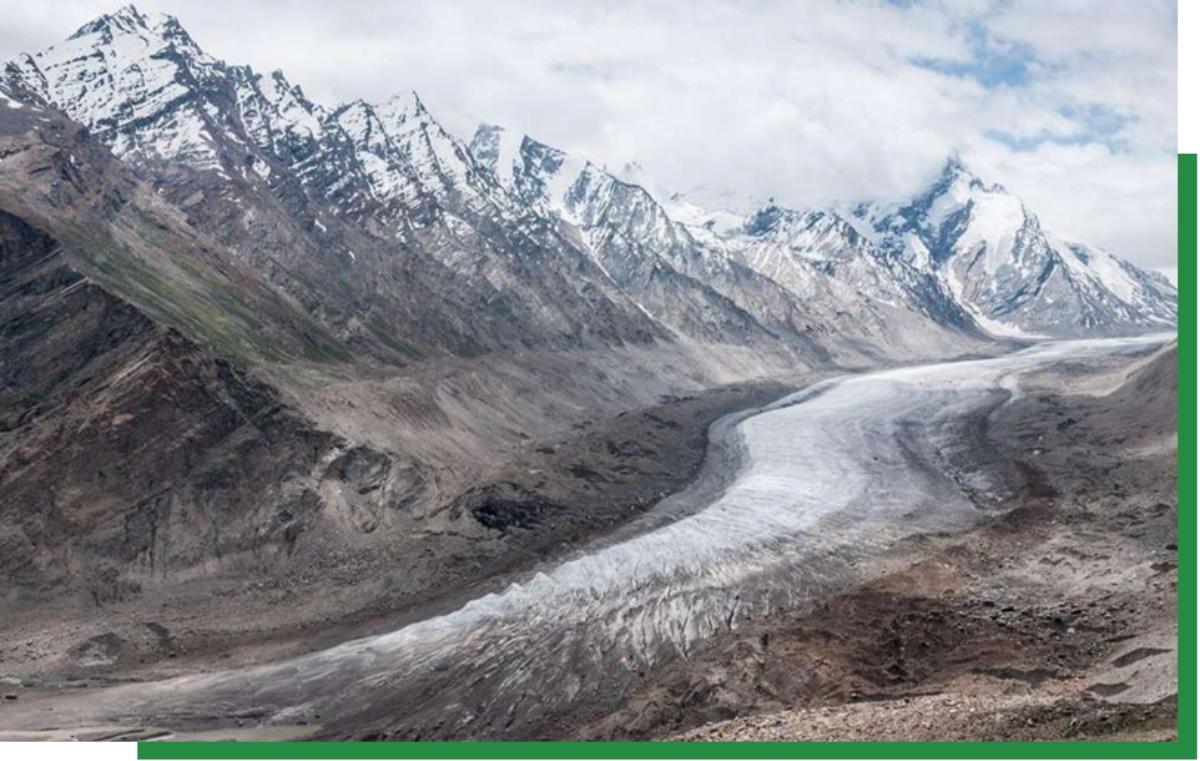
Low precipitation and limited groundwater resources makes UT heavily depend on glacier water. Most perennial rivers in Ladakh are fed by glaciers. According to the climate action plan of Jammu & Kashmir and Ladakh there are more than 4500 glaciers in Nubra, Shyok and Upper Indus sub basins. However, these sub basin cut across Himachal Pradesh and UT of Jammu & Kashmir and Ladakh[6]. Another study observed 2,257 glaciers in UT of size more than 0.5 sq km. These glaciers cumulatively cover a total geographical area of 7923 sq km in Ladakh. Of these, 2,033 glaciers are of size between 0.5 sqkm to 5 sq km.
There are seven glaciers in the UT which have size more than 100 sq km[7]. Siachen glacier is the most known glacier located in Ladakh. This is the second longest glacier (nearly 74km) outside the Polar Regions. Other prominent glaciers of the UT include Drang-Drung, Shafat, Chong Kumdan, Rimo and Nubra glaciers. A study published in Earth System Data Science in 2022, observed that glaciers are retreating at very high speed in Leh, Tsokar, Tsomoriri. However, it also observed that glacier melting speed is relatively low in Shyok sub basin[8]. The climate action plan of erstwhile state of Jammu and Kashmir also observed that glaciers are alarmingly retreating in Ladakh region[9].
Ladakh has been traditionally dependent on snow melt water for its domestic use and agro-pastoral requirements. According to a study conducted by BORDA in 2019, traditionally, Ladakh used to meet its 90% water demand from snow melt water locally called Yurea and remaining 10% from natural streams. However, the increase in local population and sudden jump in tourist influx in Ladakh along with adverse impacts of climate change on water resources have impose excessive pressure on natural water resources of the Union Territory[10]. The study further observes that these changes have led to excessive extraction of groundwater especially in Leh city. As per the study, now nearly 92% of domestic water of Leh is met from underground water resource[11]. In summer, when water is very limited, tourist visiting Leh consume nearly 20% of total available water[12]. The water consumption in the UT has suddenly increased and it has gone beyond the carrying capacity of dry Ladakh. Currently major cities of UT such as Leh are meeting its domestic water demand from ground water resources, which is highly un-stainable in the absence of effective regulations.
The index prepared by NITI Aayog has categorized entire Ladakh as a water scarcity region where the per capita availability of water is limited. The vision plan of the Ladakh UT reveals that the total water supply in the UT is just 39 lakh gallons per day against total demand of 63 lakh gallons per day[13]. In other words, there is a deficit of nearly 38% in supplying water for various uses. While the government of India claims that nearly 90% rural households in Ladakh has now connected with tap water after implementation of the Jal Jeevan Mission[14], but the vision plan of UT reveals that 96% households in Ladakh are without functional tap water connection[15].
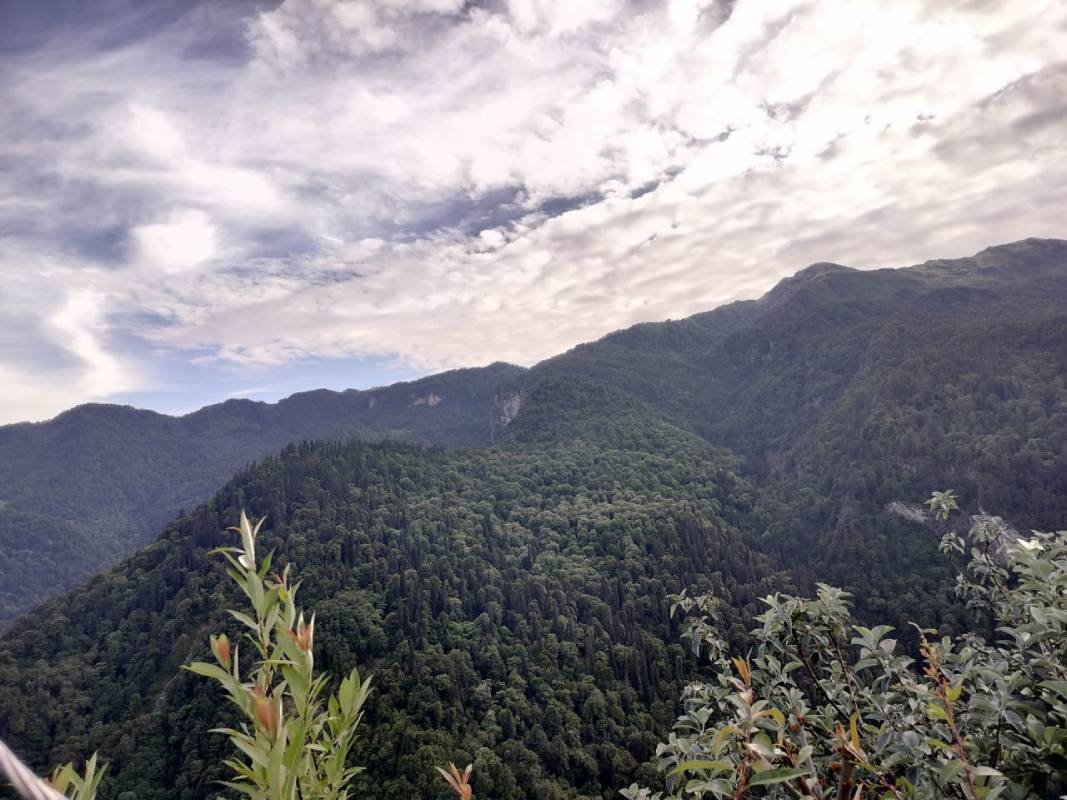
Jangal – State of Forests in Ladakh
Ladakh is a dry desert with very limited vegetation. Moreover, a large part of Ladakh is also under permanent snow cover. Its dryness, deserts, snow cover, glaciers and limited vegetation contributes to a unique Himalayan ecology and biodiversity. According to India’s State of Forest Report, 2023 released by the Forest Survey of India, its total forest cover is just 2285 sq km out of its total geographical area of 1,69,421 sq km. Forests in Ladakh are governed by two territorial forest divisions namely Leh forest division and Kargil forest division. The UT has two wildlife sanctuaries
There are a lot of inconsistencies in data related to forest area and area of recorded forests, total forest cover and area of wildlife sanctuaries in Ladakh. For example the ISFR-2023 report reveals that the UT has just 7 sq km of recorded forest. However, the same report further declares that its total forest cover inside recorded forests is 794.58 sq km[16]. Furthermore, the website of Wildlife Institute of India (WII) claims that the UT has two wildlife sanctuaries in Ladakh and cumulatively these sanctuaries covers more than 15% of the total geographical area of the UT[17].
Amid these data discrepancies, the India’s State of Forest Report (ISFR), 2023 claims that the UT has forest cover on its 2,296 sq km landmass. Of this, a substantial portion (65%) is located outside the recorded forest. Data further reveals that most of the forest is in the category of open forest with canopy density between 10 and 40. Only 23% of the forest in UT is categorized as dense forest by the ISFR-2023.
Table 3: Quality of Forest inside and outside recorded forests in Ladakh
| Forest Cover Category | Inside the Recorded Forest Area (or Green Wash) (km²) | Outside the Recorded Forest Area (or Green Wash) (km²) | Total (km²) | % Distribution Inside RFA | % Distribution Outside RFA |
| Very Dense Forest (VDF) | 2.20 | 0.07 | 2.27 | 0.28% | 0.00% |
| Moderately Dense Forest (MDF) | 183.53 | 325.54 | 509.07 | 23.10% | 21.83% |
| Open Forest (OF) | 608.85 | 1,165.73 | 1,774.58 | 76.62% | 78.17% |
| Total Forest Cover | 794.58 | 1,491.34 | 2,285.92 | 100% | 100% |
Ladakh has a unique cold desert ecosystem, which has very less canopy density. However, of the total forest area in the UT more than 52% forests are in the category of west Himalayan subalpine fir forest and Dwarf juniper scrub. These forests are followed by dry alpine scrub which contribute nearly 21% of the total forest area in Ladakh. Dry broad leaved and coniferous forest accounts for nearly 9% of the total forest area in the UT. The ISFR-2023 categorizes the forest of Ladakh into 14 different categories. Of these forest types in Ladakh, the above-mentioned three forest ecosystems account for about two third of the total forest area in the UT.
Table 4: Forest Types in Ladakh
| Sl. No. | Forest Type (Champion & Seth Classification, 1968) | Area (km²) | % of the Total Mapped Area |
| 1 | 12/C1c Moist deodar forest (Cedrus) | 2.91 | 0.11 |
| 2 | 12/C1d Western mixed coniferous forest | 7.04 | 0.27 |
| 3 | 12/C1f Low-level blue pine forest (P. wallichiana) | 1.73 | 0.07 |
| 4 | 12/C1/DS1 Oak scrub | 0.10 | 0.00 |
| 5 | 12/C1/DS2 Himalayan temperate secondary scrub | 31.93 | 1.22 |
| 6 | 13/C1 Dry broadleaved and coniferous forest (Quercus ilex – P. gerardiana) | 231.30 | 8.84 |
| 7 | 13/1S2 Populus/Salix forest | 201.99 | 7.72 |
| 8 | 14/C1a West Himalayan sub-alpine fir forest | 703.77 | 26.90 |
| 9 | 14/2S1 Sub-alpine blue pine forest (P. wallichiana) | 171.76 | 6.57 |
| 10 | 16/C1 Dry alpine scrub | 540.60 | 20.67 |
| 11 | 16/E1 Dwarf juniper scrub | 681.52 | 26.05 |
| 12 | TOF/Plantation | 36.76 | 1.41 |
| Total (Forest Cover & Scrub) | 2,611.41 | 99.83 | |
| Grassland Forest Type (outside forest cover) | |||
| 13 | 14/DS1 Sub-alpine pastures | 4.51 | 0.17 |
| 14 | 15/C3 Alpine pastures | 0.02 | 0.00 |
| Grand Total (Forest Cover, Scrub & Grasslands) | 2,615.94 | 100.00 | |
A very small part of Ladakh has vegetation recognized as forest as per the definition of Forest Survey of India. Major tree species in the UT include Salix species, Populus species, Prunus species, Salix alba and Populus ciliat. Of these salix species are in abundance providing resources such as fuel wood and timber in Leh and Kargil regions of the UT.
Jameen: State of Land in Ladakh
The entire region of Ladakh is rugged and mountainous with little vegetation. Mountains are sedimentary rocks and are disintegrating due to weathering. Soil of the UT does not support healthy agriculture as its soils are sandy and loamy in nature. Largely soils in Ladakh is deficient in organic matter and low in important minerals such as phosphorus and potash[18]. Being the sandy nature of the soil, it is highly vulnerable to erosion. Furthermore, it restricts the agricultural season in the UT.
Ladakh is categorized as a ‘cold arid’ agro ecological zone, which produces crops like barley, wheat and apricot. The limited agricultural production and short crop seasons led people to practice agro-pastoral occupations in the UT. A study conducted by Defence Institute of High Altitude Research (DIHAR) found that soils in both Kargil and Leh have very low water holding capacity. Moreover, they found that soils in both the districts of Ladakh are high in potassium and low in phosphorus. Micronutrient in soil such as zinc, iron, copper and manganese were also found below critical level[19].
Table 5: Agro Ecological Zones of Ladakh
| Agro Ecological Zone | Region | Area |
| Cold Arid | Leh and Kargil | The area varies in elevation from 3500 to 8400 meter above sea level and conducive for production of crops such as Barley, Wheat and Apricot. Nearly 100 per cent agricultural land in this region is irrigated majorly using spring water. |
https://www.jkapd.nic.in/pdf/agendaa.pdf
The land use pattern of two districts of Ladakh remains largely static in the last couple of decades. The net cropped area has marginally increased from 18.1 thousand hectare in 1998-99 to 20 thousand hectare in 1998-19. Such marginal increase was also observed in the case of total land not available for cultivation and total fallow land during these two decades. Such insignificant change in land use pattern in Ladakh is attributed to limited land for agriculture and higher dependency of communities on agro-pastoral occupations for subsistence living.
Table 6: Classification of Land of Ladakh (000 Hectare)
| Year | Land Not available for Cultivation | Other Uncultivated Land Excluding Fallow Land | Total Fallow Land | Net Area Sown | Cropped Area | ||
| Area under Non Agricultural Use | Barren and Unculturable Land | Total | |||||
| 1998-99 | 4084 | 29746 | 33830 | 9683 | 1893 | 18156 | 19087 |
| 2018-19 | 7903 | 27640 | 35543 | 6973 | 2347 | 20072 | 21567 |
https://data.desagri.gov.in/weblus/classification-of-area-report-web
While the land use pattern has not changed significantly in Ladakh in the last couple of years, the land holding is highly skewed as in other parts of the country. However compared to Jammu and Kashmir the average land holding size in Ladakh is higher. Data shows that of the total 38,612 land owners in the UT more than 80% (31,005) are marginal farmers with land holding less than 1 hectare. Less than one percent of farmers have land holding above 10 hectares.
Table 7: Land Holdings Size in Ladakh
| Class Size | Holdings | ||
| Leh | Kargil | Total | |
| Marginal (upto 1 ha) | 17306 | 13699 | 31005 |
| Small (1-2 ha) | 2875 | 2244 | 5119 |
| Semi Medium (2 to 4 ha) | 1124 | 833 | 1957 |
| Medium (4 to 10 ha) | 160 | 143 | 303 |
| Large (10ha and above | 219 | 9 | 228 |
| Total | 21684 | 16928 | 38612 |
Source: Agricultural Census 2010–2011
The total food grain production in Ladakh is around 1 lakh quintals and fruit production is 1.6 lakh quintals per year. This production is grossly insufficient for people in the UT. To meet its demand of food grains and fruits, Ladakh imports 73% of its food grains and 85% of its fruits[20]. Despite this shortage, the area under principal crops in Ladakh has decreased in the last three decades. Data shows that the area under wheat production in Leh district has decreased from 28% of the total cultivation area in 1999-00 to 14.83% in 2012-13. Similar, but lesser decline was also observed in wheat production in Kargil district during the period.
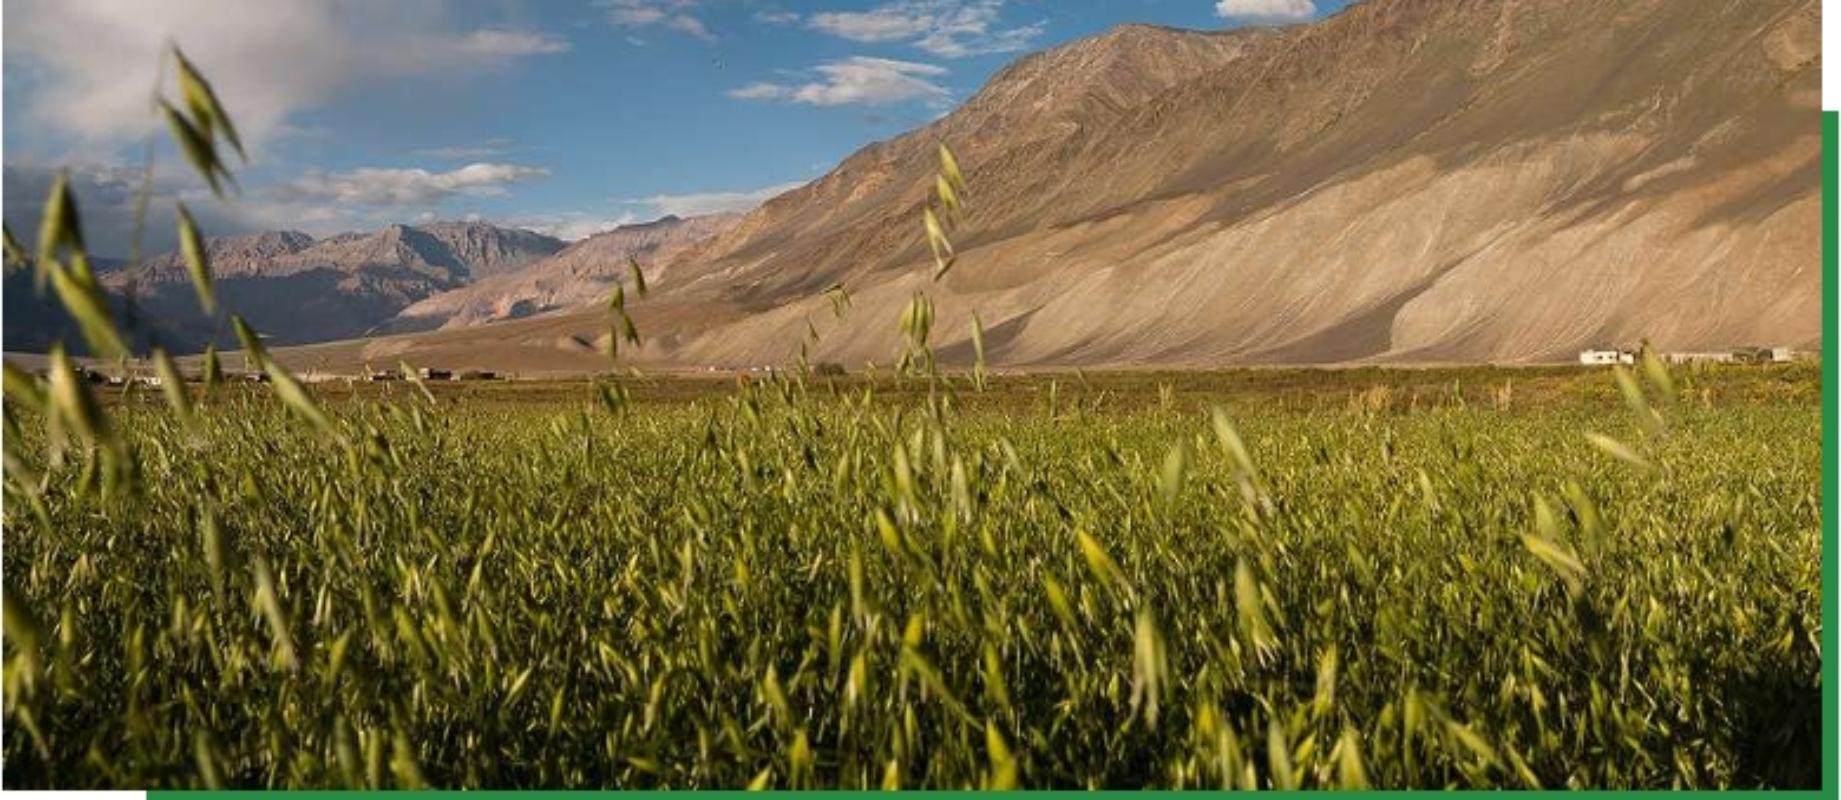
Table 8: Area under principal crops in Ladakh (in thousand hectares)
(Area in terms of percentage to total cropped area)
| Year & District | Wheat | Barley | Gram | Other Millets and Pulses | Fruits & Vege-
tables |
Oilseeds | Fodder Crop | TCA (hect-ares) |
| Leh | ||||||||
| 1999–00 | 28.23 | 1.69 | 52.69 | 5.56 | 3.14 | 0.24 | 8.45 | 9152 |
| 2004–05 | 28.36 | 0.72 | 42.15 | 5.22 | 3.04 | 0.61 | 19.91 | 10499 |
| 2009–10 | 25.37 | 0.38 | 43.81 | 5.65 | 4.22 | 0.81 | 19.76 | 10604 |
| 2012–13 | 14.83 | 0.05 | 38.97 | 11.00 | 5.55 | 1.17 | 28.43 | 7363 |
| Kargil | ||||||||
| 1999–00 | 16.27 | 39.68 | 9.24 | 3.42 | – | – | 31.39 | 9852 |
| 2004–05 | 14.08 | 37.29 | 11.08 | 2.47 | – | – | 35.09 | 9923 |
| 2009–10 | 15.99 | 32.14 | 11.95 | 3.66 | – | 0.52 | 35.79 | 10010 |
| 2012–13 | 12.13 | 39.80 | 11.00 | – | 3.53 | – | 33.54 | 10914 |
Source: Padma Dolker[21]
Barley is commonly grown in Leh and Kargil. Largely it is being cultivated in Kargil district. Its cultivation in Leh district is very less. Barley has great resilience properties in dry ecological conditions such as Ladakh. Therefore, people continue to grow barley in the UT. Area under Barley cultivation in Kargil has remained around 39% of the total cultivation area in the last three decades. A study conducted by Dolker (2018) reveals that the increasing dependency on the PDS system gradually phased out traditional cultivation of climate resilient millets. Moreover, the study observed that people have shifted from traditional millet cultivation to cultivation of cash crop and fodder crop. This shift was brought in to meet local demand of Indian armed force[22].
Table 9: Fertilizer Off‐take (Quantity in 000 Quintals), Leh
| Year | Nitrogen (000 qtls) | Phosphorus (000 qtls) | Total (000 qtls) |
| 2011–12 | 3.9 | 4 | 7.9 |
| 2012–13 | 3859 | 3780 | 7639 |
| 2013–14 | 3900 | 3260 | 7160 |
| 2014–15 | 3721 | 2818 | 6539 |
| 2015–16 | 3408 | 2967 | 6377 |
Source: District Statistical Handbook, Ladakh, 2016-17
A study on agricultural patterns in Ladakh published by Journal of Himalayan Ecology reveals that traditional agricultural practice declined recently and use of chemical fertilizers and mechanization started (Dolker, 2018). This statement is further validated by the fertilizer off-take data of Leh district compiled from district statistical handbook. The data suggest that the total nitrogen and phosphorus purchasing has increased from just 7.9 thousand quintals in 2011-12 to over 6000 thousand quintals in 2015-16.
Changes in climatic conditions, agricultural practices and land use change are some major factors that have affected local soil and land. The soil which had low micronutrient is now dependent on chemical fertilizers for better yield. The degradation of land and soil is also evident in data released by the Space Application Centre of ISRO. According to their data as much as 42.31% of Ladakh’s geographical area is degraded and deserted. More importantly, since 2003-05 more than 3% of Ladakh’s land has degraded, which indicates the intensity and pace of land degradation in the UT.
Table 10: Desertification / Land Degradation Data
| Process of Desertification / Land Degradation | 2018–19 Area (ha) | 2018–19 Area (%) | 2011–13 Area (ha) | 2011–13 Area (%) | 2003–05 Area (ha) | 2003–05 Area (%) |
| Vegetation Degradation | 1,122,940 | 6.68 | 1,115,514 | 6.64 | 1,098,797 | 6.54 |
| Water Erosion | 9,243 | 0.05 | 9,243 | 0.05 | 9,243 | 0.05 |
| Wind Erosion | 1,738,937 | 10.34 | 1,673,347 | 9.95 | 1,653,634 | 9.84 |
| Mass Movement | 941,083 | 5.60 | 929,710 | 5.53 | 845,213 | 5.03 |
| Frost Shattering | 3,082,140 | 18.32 | 2,964,674 | 17.64 | 2,752,763 | 16.28 |
| Barren / Rocky | 219,725 | 1.31 | 219,058 | 1.30 | 207,234 | 1.22 |
| Total Area under Desertification | 7,111,968 | 42.31 | 6,911,573 | 41.12 | 6,576,853 | 39.11 |
| No Apparent Degradation | 9,513,355 | 56.59 | 9,714,757 | 57.79 | 10,044,881 | 59.76 |
| Total Geographical Area | 16,809,700 | – | 16,809,700 | – | 16,809,700 | – |
https://vedas.sac.gov.in/static/atlas/dsm/DLD_Atlas_SAC_2021.pdf
Major factors responsible for desertification and degradation in Ladakh include vegetation degradation, water erosion, wind erosion, mass movement and frost shattering. Because of the cold weather, the frost shattering is a major cause of land degradation in Ladakh. Estimates of SAC reveal that more than 18% of land has been degraded in Ladakh due to frost shattering. Frost shattering is followed by wind erosion as the second most land degrading factor responsible for degradation of more than 10% of the total land mass of the UT. From 2003-05 to 2018-19, both of these major factors behind land degradation and desertification have degraded an additional 2.54% of Ladakh.
Jalvayu Parivartan – Climate Change in Ladakh
Both districts of Ladakh namely Leh and Kargil are located on the Himalayas’ rain-shadow side but at very high elevation. It receives very cold and dry wind after leaving its humidity and water content in the plain and other Himalayan regions. All these natural climate conditions make the climate very harsh. The average elevation of Ladakh is 3650 meter above sea level therefore its minimum temperature ranges from -20 degree centigrade to -40 degree centigrade in the months from December to February. The highest temperature of Ladakh also goes very high in summer. The temperature in summer goes as high as +35 degree centigrade[23]. Ladakh is also known as cold desert because of its harsh, arctic and desert climates.
January is the coldest month in Ladakh when the mean minimum temperature is about -14.4 degree centigrade and man maximum temperature is about -2 degree centigrade. The temperature rises gradually from March onwards till August. August is the hottest month with mean maximum temperature 25.3 degree centigrade and mean minimum temperatures about 10 degree centigrade.
Table 11: Mean rainfall (mm) and number of rainy days
| District | Type | Jan | Feb | Mar | Apr | May | Jun | Jul | Aug | Sep | Oct | Nov | Dec | Annual |
| Kargil | Rain | 35.0 | 38.9 | 44.2 | 31.7 | 30.0 | 12.9 | 22.9 | 32.1 | 10.1 | 13.4 | 24.0 | 24.2 | 319.4 |
| Kargil | Day | 3.2 | 3.3 | 4.3 | 2.9 | 3.2 | 1.3 | 1.4 | 1.2 | 1.1 | 1.0 | 1.7 | 2.0 | 26.6 |
| Leh | Rain | 7.1 | 7.7 | 9.9 | 8.1 | 7.9 | 5.3 | 15.6 | 12.5 | 10.1 | 4.1 | 2.8 | 5.6 | 96.7 |
| Leh | Day | 1.0 | 1.0 | 1.2 | 0.9 | 0.9 | 0.7 | 1.6 | 1.6 | 1.0 | 0.4 | 0.3 | 0.8 | 11.4 |
While Ladakh is very cold, it receives very less precipitation. The annual rainfall in Kargil is 319mm and in Leh is just 96mm. Rainy days in Kargil in a year are around 26 days, whereas, it is just 11 days in Leh. Pre monsoon showers the region most. In this season, Ladakh receives 32% of its total precipitation. Moreover, both winter and south west monsoon season contributes 29% each of total rainfall[24].
A study by Qin et al (2018) published in the Journal of Mountain Science observed that the temperature of Ladakh is steadily increasing. More importantly, the winter temperature is increasing. Such an increase is threatening glaciers as they are melting at a higher rate. Moreover, the study found variability in snowfall and unpredictable seasonal precipitation in recent decades[25]. Another study by Ahmed and Mir (2019) also found seasonal variation in precipitation in Ladakh adversely affecting agriculture and water availability[26].
[1] Central Water Comission, 2014, ‘Indus Basin’ Ministry of Water Resources, Government of India. https://indiawris.gov.in/downloads/Indus%20Basin.pdf
[2] Central Water Comission, 2014, ‘Indus Basin’ Ministry of Water Resources, Government of India. https://indiawris.gov.in/downloads/Indus%20Basin.pdf
[3] Ministry of Earth Science, 2014, ‘Climate of Jammu and Kashmir’, Government of India.
https://diragrijmu.nic.in/CSS%20GUIDELINES/FINAL_CLIMATE%20OF%20JAMMU%20AND%20KASHMIR_e%20book.pdf
[4] Central Ground Water Board, 2024, Dynamic Groundwater Resoruces of Ladakh, Government of India: https://www.cgwb.gov.in/cgwbpnm/public/uploads/documents/1705645840276258499file.pdf
[5]rajyasabha unstarred question no. 1690 to be answered on 18/12/2023: https://sansad.in/getFile/annex/262/AU1690.pdf?source=pqars&utm_source=chatgpt.com
[6] Ministry of Environment and Climate Change, 2017, ‘State Action Plan on Climate Change, GoI: https://moef.gov.in/uploads/2017/08/Jammu-Kashmir.pdf
[7]Soheb, M., Ramanathan, A., Bhardwaj, A., Coleman, M., Rea, B. R., Spagnolo, M., Singh, S., and Sam, L.: Multitemporal glacier inventory revealing four decades of glacier changes in the Ladakh region, Earth Syst. Sci. Data, 14, 4171–4185:https://essd.copernicus.org/articles/14/4171/2022/?utm_source=chatgpt.com#&gid=1&pid=1
[8]Soheb, M., Ramanathan, A., Bhardwaj, A., Coleman, M., Rea, B. R., Spagnolo, M., Singh, S., and Sam, L.: Multitemporal glacier inventory revealing four decades of glacier changes in the Ladakh region, Earth Syst. Sci. Data, 14, 4171–4185https://essd.copernicus.org/articles/14/4171/2022/?utm_source=chatgpt.com
[9] Ministry of Environment and Climate Change, 2017, ‘State Action Plan on Climate Change, GoI https://moef.gov.in/uploads/2017/08/Jammu-Kashmir.pdf
[10] Hirra Azmat, 2024, ’Rapid urbanisation and climate change threaten groundwater resources in Ladakh, says study’, Mongabay:
[11]BORDA, 2019, ‘Water in Liveable Leh’, BORDA South Asia: https://ladakh.iisdindia.in/pdf/Leh%20Water%20Report%202019%20BORDA%20LEDeG.pdf
[12] Hirra Azmat, 2024, ’Rapid urbanisation and climate change threaten groundwater resources in Ladakh, says study’, Mongabay: https://india.mongabay.com/2024/07/rapid-urbanisation-and-climate-change-threaten-groundwater-resources-in-ladakh-says-study/
[13] EY, Vision 2050 for UT of Ladakh: https://cdnbbsr.s3waas.gov.in/s395192c98732387165bf8e396c0f2dad2/uploads/2020/09/2020092627.pdf
[14]Rajya Sabha unstarred question no. 1690 to be answered on 18/12/2023: https://sansad.in/getFile/annex/262/AU1690.pdf?source=pqars&utm_source=chatgpt.com
[15] EY, Vision 2050 for UT of Ladakh: https://cdnbbsr.s3waas.gov.in/s395192c98732387165bf8e396c0f2dad2/uploads/2020/09/2020092627.pdf
[16] ISFR, 2023, FCI, Dehradun
[17]Wildlife Institute of India: https://wii.gov.in/wildlife_sanctuaries
[18] Central Groundwater Board, District Ground Water Information Brochure, Leh district: https://www.cgwb.gov.in/old_website/District_Profile/JandK/Leh.pdf
[19] DIHAR, 2012, ‘improving soil health status of cold desert ladakh region’: http://cazrienvis.nic.in/lehpdf/240001.pdf
[20] EY, Vision 2050 for UT of Ladakh https://cdnbbsr.s3waas.gov.in/s395192c98732387165bf8e396c0f2dad2/uploads/2020/09/2020092627.pdf
[21]Padma Dolker, 2018, An Overview of Transition in Traditional Agriculture of Ladakh, J. Himalayan Ecol. Sustain. Dev. Vol. 13 (2018) ISSN 0973-7502 26: https://envirsc.uok.edu.in/Files/ab1ac1f1-07e3-42a2-85bc-83717ef39155/Menu/Final_copy_Journal_2018-28-50_compressed_967e6ad7-6477-42da-8d50-62d5ffd8df25.pdf
[22]https://cdn.s3waas.gov.in/s3291597a100aadd814d197af4f4bab3a7/uploads/2018/09/2018090728.pdf
[23] Padma Dolker, 2018, op.cit.
[24] Padma Dolker, 2018, op.cit.
[25] Qin, D., Liu, C., & Li, P. (2018). Observed climate variability in the Trans‐Himalayan region (Ladakh) and its implications for water resources. Journal of Mountain Science, 15(4), 753–767
[26]Romshoo, S. A., Rashid, I., & Shah, R. A. (2012).Impact of climate change on the melting of Dokriani and Siachen glaciers in the Indian Himalayas. Current Science, 103(3), 317–324.
