Introduction
Use of surface water storages for irrigation has been an age old practice in India. After independence, India invested huge amounts on creating surface water and canal infrastructure. The ground water resources became a choice of farmers for irrigation through the construction of millions of private wells, resulting in a phenomenal growth in the exploitation of groundwater in the last six decades. Today, India is the largest groundwater user in the world, with an estimated usage of around 230 cubic kilometres per year, more than a quarter of the global total. With more than 60 percent of irrigated agriculture and 85 percent of drinking water supplies dependent on it, groundwater is a vital resource for rural areas in India (World Bank, 2010).
With increased access to knowledge, technology, finance and energy for the purpose of groundwater extraction, depletion of groundwater is a serious issue that has now turned into a water crisis in many parts of the country. The gap in demand and supply is continuously increasing, as also the numbers of critical and over exploited units are on rise. This mismanagement of natural wealth has serious social, economic and ecological consequences. In order to address the problem, one of the hindrances is the lack of data on the geological and hydrological characteristics and the health of the aquifers in different regions. The present study is an attempt to study the ground situation in some of the critical regions of India, with a view to provide guidance for sustainable groundwater management in India. The present assessment of groundwater situation in Maharashtra, which is presented in this note, has been taken up towards this end.
Groundwater has been the most preferred source of water for domestic use and irrigation in Maharashtra since 1970s. Changes in groundwater availability and quality impact human health, livelihoods, food security and economic development. Sustainable management of groundwater requires reliable estimates of its availability and dependability in terms of the timing, quantity or quality. This paper looks at the assessment of groundwater resources carried out in Maharashtra state over the last two decades.
The objective of the study is to develop an overview of the hydro-geological characterises of Maharashtra state and the extent of ground water extraction. It entails the study of the key characteristics of hydrology and hydrogeology of the state and the extent of groundwater availability on a sustainable extraction basis. It also looks at the state of groundwater extraction in the state at present and how has it changed over the years.
This note is based on a quick review of available reports and papers from official agencies and academics. It is written with a view to provide an overview of the situation of groundwater management in the state, and more importantly, to give a diagnostic view of the broad canvas on which the future strategies of groundwater management should be designed and developed.
The hydro-geological characteristics of the state were understood from the textbooks on geology and the finer aspects were understood from the academics and experts through discussions. Groundwater Survey and Development Agency (GSDA), which is the groundwater department of Government of India and Central Ground Water Board (CGWB) carried out periodic assessments in the state. Their reports were used to analyse the status of groundwater for this note. In addition, some research papers and articles on localised observations were used to corroborate the findings of the official assessment report.
Hydro-geology of Maharashtra
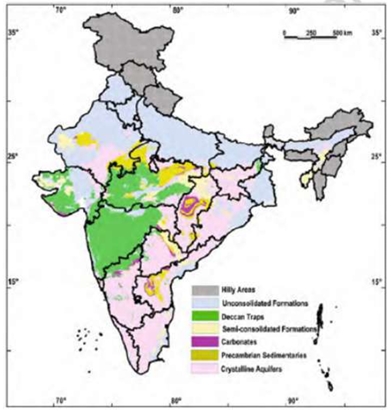
Fig 1 : Hydrogeological Map of India
Maharashtra, the third largest state in India has a total geographical area of 307,762 sq km, lies between latitudes of 15°45’ and 22° 00’ N and longitudes of 73° 00’ and 80° 59′ E in the west-central part of India (Fig 1). Maharashtra is divided in three main physiographic units the Sahyadri Range (Western Ghats), the Western Coastal Tract (Konkan), and The Eastern Plateau (Deccan Plateau). It is drained by Rivers Godavari, Krishna, Tapi, Mahanadi, Narmada and westward flowing rivers of Konkan; these constitute the six major river basins (Fig 2).
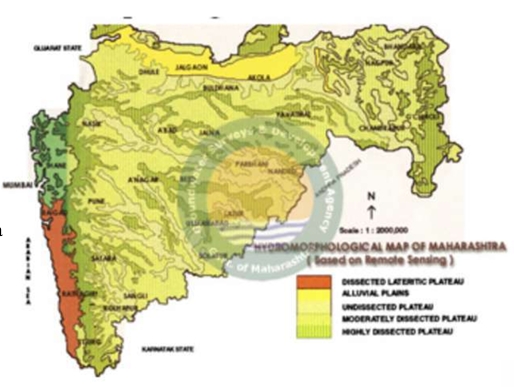
Fig 2 : Physiographic Map of Maharashtra
Maharashtra has five socio-cultural regions namely Konkan, Western Maharashtra, Khandesh, Marathwada and Vidarbha, which broadly match with the six administrative divisions namely Konkan, Pune, Nashik, Aurangabad, Amravati and Nagpur. These administrative divisions are divided into 36 districts. Further, the State can be divided into six distinct agro-climatic zones, each with its typical hydro-meteorological parameters. Thus, Maharashtra State has diverse physiography, hydrology and hydrogeology besides varying rainfall patterns. Physiography and geology have played a vital role in the availability of natural resources including water resources.
Geology of Maharashtra
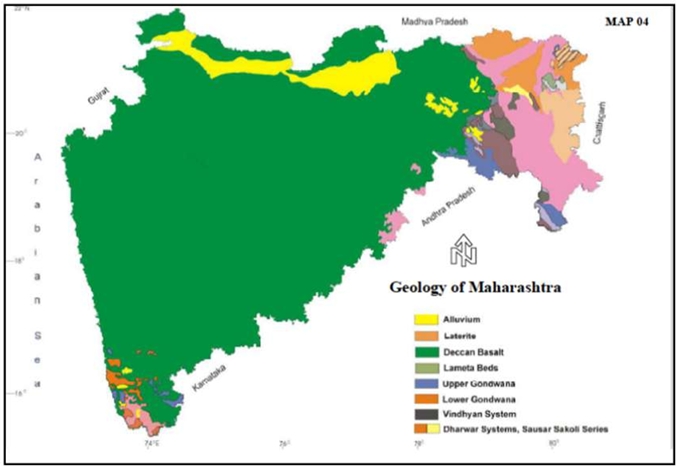
Geology of Maharashtra State is practically the geology of Deccan Trap, which occur in all the districts of the State excepting Bhandara. The other geological formations, older and younger than Deccan Trap, occur in the districts of Bhandara, Wardha, Chandrapur, Gadchiroli, Nagpur, Yavatmal, Buldhana, Akola, Amravati, Dhule, Jalgaon, Nanded, Kolhapur, Sindhudurg and Ratnagiri. In the remaining 14 districts, Deccan Trap is the only geological formation occurring in them. These Deccan Traps are capped by laterites as seen in Raigad, Ratnagiri, Sindhudurg, Satara, Sangali, Kolhapur and Osmanabad districts. The distribution of these formations is given in Table 1 and depicted in Fig 3 below.
Table 1 : Geology of Maharashtra
| S No | Formation | Area, sq km | Percentage |
| 1 | Pleistocene and Quaternary Alluvial Sediment | 14,500 | 4.71 |
| 2 | Deccan Trap lava flows | 2,50,000 | 81.20 |
| 3 | Gondwana Sedimentary rock formation | 4,800 | 1.55 |
| 4 | Vindhyan and Cuddappah Pre-Cambrian sediments | 6,200 | 2.00 |
| 5 | Archean and Dharwad Metamorphic complexes | 32,200 | 1.048 |
(Source : GSDA)
Fig 3. Geology of Maharashtra
Groundwater Assessment Methodology
Assessment of groundwater resources assumed importance as dependence on groundwater for drinking and domestic uses and irrigation started growing. In Maharashtra, groundwater exploration was started in 1973 soon after the formation of Groundwater Survey and Development Agency (GSDA) as the state groundwater department. A comprehensive groundwater resource assessment in Maharashtra was carried out in 1979. From 1987 onwards, it became almost a regular feature with an interval of about 3-4 years. The Central Ground Water Board (CGWB) started collaborating with these state level initiatives, and from the turn of the century started compiling the report at national level.
Methodology: While the first ad hoc attempt of estimating groundwater resources in Maharashtra was made during 1973, the first scientific assessment was carried out during 1979 on the basis of Overexploitation Committee Report published by Agricultural Refinance and Development Corporation (ARDC). Since then, various committees constituted by Government of India and Government of Maharashtra have suggested improvements in the methodology to estimate the groundwater resources. The estimations of 1987 and 1990 were carried out based on the methodology suggested by Groundwater Estimation Committee constituted in 1982 by Government of India (GEC-84), whereas that from 2000 to 2013 were carried out according to the guidelines of the Groundwater Estimation Committee 1997 (GEC-97). Subsequently, the guidelines were further modified in 2015 (GEC-15), which were used for assessment during 2017 and 2020 (Table 2).
Table 2 : Key characteristics of Groundwater Assessment Studies in Maharashtra
| Details of assessment | 1988 | 1990 | 2000 | 2004 | 2008 | 2011 | 2013 | 2017 | 2020 |
| No of Watersheds | 1,505 | 1,505 | 1,505 | 1,505 | 1,531 | 1,531 | 1,531 | 1,531 | 1,535 |
| Methodology | GEC-84 | GEC-84 | GEC-97 | GEC-97 | GEC-97 | GEC-97 | GEC-97 | GEC-15 | GEC-15 |
(Source: Compiled by author from GSDA and CGWB data)
The state of Maharashtra has 35 districts and 353 talukas, out of which the two urban districts of Mumbai and Mumbai Suburban (erstwhile Bombay and Greater Bombay districts) were excluded from the assessment, thus covering the remaining 33 districts which are rural. Until 2004, the estimation was carried out for 29 districts before bifurcation, i.e., combined estimate for Parbhani-Hingoli, Dhule-Nandurbar, Bhandra-Gondia and Akola-Washim. Similarly, the 2004 assessment compiled the status based on 318 talukas before bifurcation.
For the purpose of groundwater estimation and evaluation, Maharashtra State was divided into 1535 elementary watersheds (This number was 1505 until 2004, 1531 from 2008 to 2013 and 1535 from 2017 onwards). The recharge was estimated for the groundwater worthy area of all the watersheds, while the non-worthy area comprising of steep slopes more than 20 per cent, hill tops and rocky wastelands have been left out. Each watershed was further delineated into poor groundwater quality area, where the quality of the groundwater was beyond the usable limits, as also into command and non-command area. In this fashion, each watershed was divided into three assessment subunits, but all the subunits may not be present in the single watershed. Hence, the assessment was carried out on a watershed basis, although initially the assessment was carried out for the command and non-command areas.
Classification: Until 1990, the status of groundwater situation was defined using the following terminology, as per the protocols of GEC-84. For working out the water balance, 70% of the gross extraction was taken as net draft. The rest 30% was presumed to go as return flow to the groundwater regime. The categories of watersheds were made on the basis of stage of development over a five year period (Table 3).
Table 3 : Categories of Watersheds (until 1990)
| S No | Stage of Development | Category |
| 1 | Up to 65% | White |
| 2 | 65% to < 85% | Grey |
| 3 | 85% to < 100% | Dark |
| 4 | Over 100 % | Overexploited |
From the assessment of 2004 onwards, the status of groundwater situation was defined using a new terminology, in line with the recommendation of GEC-97. The units of assessment are categorised for groundwater development based on two criteria, viz., stage of groundwater development, and long term trend (preferably, over a period of 10 years) of pre and post monsoon water levels. The assessment of 2011-12 was based on the guidelines issued in 2010 (first in January and subsequently revised in July 2010). The national level groundwater assessment of 2019-20 was carried out following the guidelines mentioned in the GEC-2015 methodology using appropriate assumptions depending on data availability. However, the Groundwater Yearbook of 2019-20 for Maharashtra is silent on the methodology.
Four categories were defined as safe, semi-critical, critical and over-exploited. In Semi-Critical areas, cautious groundwater development is recommended; whereas in Critical and Over-exploited areas, intensive monitoring and evaluation was recommended and water conservation measures along with any future ground water development. The criteria for categorisation of assessment units are as follows (Table 4).
Table 4 : Criteria of categorisation (After 2000)
| S No | Stage of GW Development | Significant Long Term Decline | Category | |
| Pre-monsoon | Post-monsoon | |||
| 1 | Up to 70% | No | No | SAFE |
| Yes/No | No/Yes | To be re-assessed* | ||
| Yes | Yes | To be re-assessed* | ||
| 2 | 70% to 90% | No | No | SAFE |
| Yes/No | No/Yes | SEMI CRITICAL | ||
| Yes | Yes | To be re-assessed* | ||
| 3 | 90% to 100% | No | No | To be re-assessed* |
| Yes/No | No/Yes | SEMI CRITICAL | ||
| Yes | Yes | CRITICAL | ||
| 4 | Over 100% | No | No | To be re-assessed* |
| Yes/No | No/Yes | OVER EXPLOITED | ||
| Yes | Yes | OVER EXPLOITED | ||
*Note : The term ‘To be re-assessed’ means that the computation should be reviewed and the reliability of the data used is to be checked for the purpose of categorisation.
Groundwater Situation
The groundwater assessment, both recharge and draft, was carried out considering watershed as unit and within that command, non-command and poor quality zones as subunits. The final assessment of the potential is apportioned and presented as taluka wise. For the purpose of analysis, this study looked at the periodic assessments carried out from 1987-88 to 2019-20. However, data on similar variables was not available consistently for this period, and therefore, the trends from 2000 to 2020 were analysed for those variables for which data was available.
Groundwater availability: The total rechargeable groundwater resource has been around 30 billion cubic metres (BCM) to 35 BCM. However, a slight reduction (of around 5%) is expected on account of outflows or losses from the aquifer, and around 95% of it is available for abstraction as the net amount. The groundwater withdrawal has been varying from 13.33 BCM in the year 2000 to 17.18 BCM in year 2011 (Fig 5).
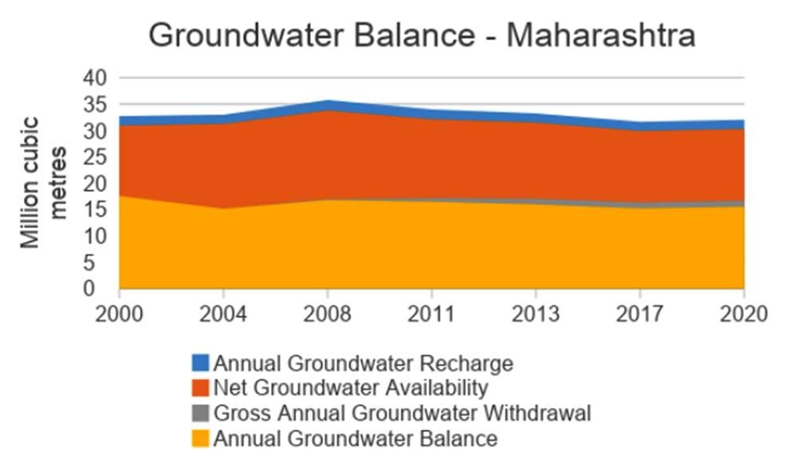
Fig 5 : Trends in dynamic groundwater resources
There has been a reduction in this figure during the last two assessments (16.33 BCM in 2017 and 16.63 BCM in 2020), which is due to change in methodology as per the GEC-15 guidelines, where the draft was calculated on the basis of the wells which were functional during the year. It was observed that the Gross Annual Withdrawal has been continuously increasing from 43.15% of the Net Groundwater Available in 2000 to 54.97% in 2020. The increase in draft has mainly been due to increase in number of irrigation wells (Table 5).
Table 5: Trends in groundwater availability and withdrawal (in BCM)
| S No | Details of assessment | 2000 | 2004 | 2008 | 2011 | 2013 | 2017 | 2020 |
| 1 | Annual Groundwater Recharge | 32.69 | 32.96 | 35.73 | 33.95 | 33.19 | 31.64 | 32.01 |
| 2 | Net Groundwater Availability | 30.89 | 31.21 | 33.81 | 32.15 | 31.48 | 29.90 | 30.25 |
| As % of Net availability | 94.49 | 94.70 | 94.61 | 94.71 | 94.85 | 94.50 | 94.50 | |
| 3 | Gross Annual Groundwater Withdrawal | 13.33 | 15.09 | 17.00 | 17.18 | 17.07 | 16.33 | 16.63 |
| As % of Net availability | 43.15 | 48.34 | 50.29 | 53.42 | 54.22 | 54.62 | 54.97 | |
| 4 | Annual Groundwater Balance | 17.56 | 15.13 | 16.81 | 16.45 | 15.93 | 15.19 | 15.54 |
(Source : Compiled by author from GSDA and CGWB data)
Categorisation: The categorisation of watersheds according to the severity of groundwater exploitation until 1990 is presented int eh following table.
Table 6: Categories of Watersheds (until 1990)
| S No | Category | Stage of Development | No of watersheds in 1987 | No of watersheds in 1990 |
| 1 | White | Up to 65% | 1414 | 1392 |
| 2 | Grey | 65% to < 85% | 57 | 87 |
| 3 | Dark | 85% to < 100% | 34 | 26 |
| 4 | Overexploited | Over 100 % | 0 | 0 |
(Source: GSDA)
The names of the categories and method of categorisation changed from 2004 onwards as per the GEC guidelines. The observed trend is presented graphically in Fig 5 below.
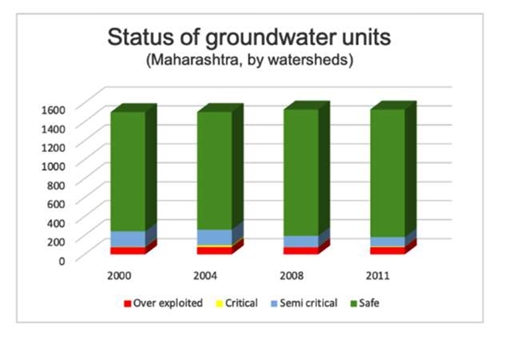
Fig 5 : Categorisation of Watersheds (2000-2011)
It may be noted that the watershed-wise data on the categories are not available from GSDA from 2013 onwards as these reports are not yet made public (Table 7a).
Table 7a: Watershed-wise Groundwater Status
| Number of watersheds | 2000 | 2004 | 2008 | 2011 | 2013 | 2017 | 2020 |
| Over exploited | 72 | 76 | 73 | 76 | |||
| Critical | 6 | 20 | 3 | 4 | |||
| Semi critical | 164 | 163 | 119 | 100 | |||
| Safe | 1257 | 1242 | 1332 | 1347 |
(Source : Compiled by author from GSDA and CGWB data)
The Central Ground Water Board compiles and published the data on the basis of administrative units like Tehsils, Talukas, Blocks, Mandals, etc. The trends in block-wise categorisation indicates that the proportion of unsafe blocks has been increasing over the years (Fig 6).
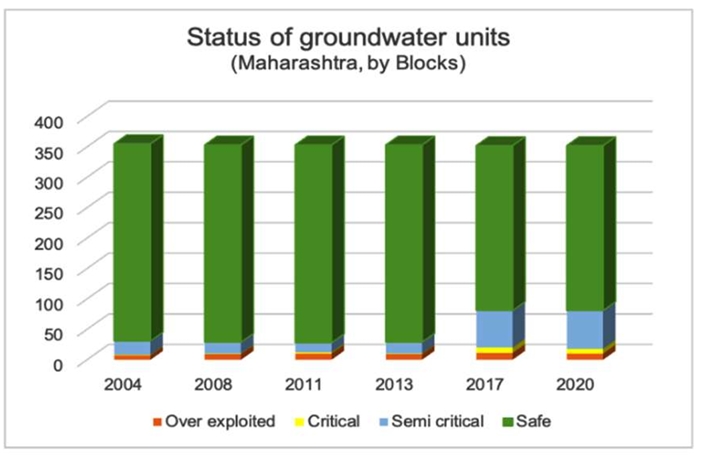
Fig 6 : Categorisation of Blocks (2000-2011)
While the trend does not prominently show any major changes in the over-exploited blocks, the rise in the critical and semi-critical blocks has been on the rise (Table 7b). Even if we tend to attribute the sudden jump in the number of such blocks from 2017 onwards due to change in methodology, the other parameters are indicative of the declining trend.
Table 7b: Block-wise Groundwater Status
| Number of blocks | 2004 | 2008 | 2011 | 2013 | 2017 | 2020 |
| Over exploited | 7 | 9 | 10 | 9 | 11 | 10 |
| Critical | 1 | 1 | 2 | 1 | 9 | 8 |
| Semi critical | 23 | 19 | 16 | 19 | 61 | 63 |
| Safe | 287 | 324 | 325 | 324 | 271 | 271 |
(Source: CGWB)
CGWB has also been publishing the changes in the categories of blocks, which corroborates the above observation on trends (Table 8). While the figure of 345 blocks out of 353 showing no change may be consoling, it has to be viewed in the overall context and other indicators.
Table 8: Change in status of blocks in successive assessments
| Category | 2011-2013 | 2013-2017 | 2017-2020 |
| Improved | 5 | 3 | 5 |
| Deteriorated | 5 | 63 | 3 |
| No change | 343 | 286 | 345 |
Discussion on Current and Future Scenarios
Status and trends
Out of the total area under irrigation, groundwater accounts for 71%-75% across different years. Out of the total groundwater consumed, 85 per cent is for irrigation, 10 per cent is for industries and only 5 per cent is for domestic consumption. Drinking water needs of 90 per cent of the total rural population are entirely met from groundwater.
The groundwater balance, or the amount of groundwater available for abstraction for various uses, has been broadly around 15 BCM or 45%-55% of the net groundwater availability during the last two decades. Unfortunately, major part of it exists in the areas where development is not required for either irrigation or for drinking and/or is in areas, which are not favourable for development.
Potential and constraints
Groundwater availability depends on good rainfall in addition to the recharge from surface irrigation systems and soil water conservation measures, which replenished the groundwater in the non-monsoon period. On the other hand, the use in areas where well irrigation is common, the draft is often limited by the availability. Thus, higher monsoon rainfall leads to higher recharge, which further leads to increase in groundwater abstraction and use.
Identifying groundwater occurrence and assessing its availability in hard rock area are affected by the assessment geological formation and availability of reliable data. An example of the latter is the data on irrigation wells. After electrification of wells the numbers of irrigation wells with pumpsets are increasing continuously. As per the estimate of GSDA (2013), there were 10.07 lakh irrigation wells with pumpsets in the year 1988, which rose to 16.71 lakhs in the year 2007 and 21.07 in the year 2011.
It is a well-known fact that large number of irrigation borewells or tubewells are the main source of irrigation in all the parts of the State and large number of them are not on Revenue records or on electricity connections. The draft from those borewells or tubewells was the missing component from the assessment.
Groundwater occurrence is affected by the geological formation. Basaltic aquifers which occupy most part of Maharashtra comprise multiple flows (traps), each one being marked by a potential vesicular zone at the top and a massive rock unit underneath. The weathered part of the top flow and the vesicular zone of the successive flows below and the intertrappeans form aquifers. Groundwater occurs more in the cracks and fissures in these rocks. Locating and marking these flows and understanding their characteristics is a challenge and it affects the determination of aquifer expanse, which is the main factor in computing the volume of rechargeable groundwater.
Methodologies of assessment play important role in accurate and realistic estimation. Conventional approaches to understanding groundwater resources involve “geological provinces” or aquifer types can capture the gross physical characteristics of regional geological systems and the coverage of such systems. However, this classical approach, especially in the diverse context of India, not only simplifies the physical conditions that determine the storage, transmission and quality of groundwater, but remains only one-dimensional in failing to capture the anthropogenic dynamics that drive groundwater use.
The changes in suggested methodology from GEC-97 to GEV-2015 in the norms (threshold values for rainfall recharge, seepage from WCS, etc) marginal decrease in draft was observed during 2017 assessment, due to revision of well census data on the basis of functional wells. It led to the reduction in estimates of annual groundwater recharge from 33.19 to 31.64 BCM, annual extractable groundwater recharge from 31.48 to 29.90 BCM and annual ground water extraction from 17.07 to 16.33 BCM.
To summarise, while the overall trends do not show a serious decline in groundwater availability in the state as a whole, there are several areas facing scarcity. Further, the demand for groundwater is on the rise. All these issues have to be addressed through a slew of measures for both supply side management (augmentation and recharge) and demand side management (water budgeting, water use planning, optimising allocations and monitoring use). The legal and policy instruments and their operationalisations are likely to help in the process.
Bibliography
CGWB (2016); Groundwater Year Book of Maharashtra and Union Territory of Dadra and Nagar Haveli (Water Year 2015-16); Nagpur, Central Ground Water Board, Central Region; September 2016
CGWB (2017); Groundwater Year Book of Maharashtra and Union Territory of Dadra and Nagar Haveli (Water Year 2016-17); Nagpur, Central Ground Water Board, Central Region; October 2017
CGWB (2019); Groundwater Year Book of Maharashtra and Union Territory of Dadra and Nagar Haveli (Water Year 2018-19); Nagpur, Central Ground Water Board, Central Region; December 2019
CGWB (2021); Groundwater Year Book of Maharashtra and Union Territory of Dadra and Nagar Haveli (Water Year 2019-20); Nagpur, Central Ground Water Board, Central Region; January 2021
CGWB (2021a); National Compilation on Dynamic Ground Water Resources of India, 2020; Faridabad, Central Ground Water Board; June 2021
GSDA (2004); Report on the Dynamic Ground Water Resources of Maharashtra as on March 2004 by Groundwater Surveys and Development Agency (GSDA) and Central Ground Water Board (CGWB), Central Region, Nagpur; Pune, Groundwater Surveys and Development Agency (undated).
GSDA (2011); Report on the Dynamic Ground Water Resources of Maharashtra (2008-2009) by Groundwater Surveys and Development Agency (GSDA) and Central Ground Water Board (CGWB), Central Region, Nagpur; Pune, Groundwater Surveys and Development Agency; March 2011.
GSDA (2014); Report on the Dynamic Ground Water Resources of Maharashtra (2011-12) by Groundwater Surveys and Development Agency (GSDA) and Central Ground Water Board (CGWB), Central Region, Nagpur; Pune, Groundwater Surveys and Development Agency; February 2014
Jha, B. M and S K Sinha (2009); Towards Better Management of Ground Water Resources in India; J. Water and Energy International; 67(1).
Moench, Marcus, Ajaya Dixit, S. Janakarajan, M. S. Rathore and Srinivas Mudrakartha (20); The Fluid Mosaic : Water Governance in the Context of Variability, Uncertainty and Change; Kathmandu, Nepal, Nepal Water Conservation Foundation.
Suhag, Rupal (2016); Overview of Groundwater in India; PRS India; February 2016. Available at: https://prsindia.org/files/policy/policy_analytical_reports/1455682937–Overview%20of%20Ground%20Water%20in%20India_0.pdf (Accessed : 12 Feb 2022)
World Bank (2010); Deep Wells and Prudence : Towards Pragmatic Action for
Addressing Groundwater Overexploitation in India; Washington DC, The World Bank