 No power on earth can stop an idea whose time has come .. the emergence of India as a major economic power in the world happens to be one such idea. Let the whole world hear it loud and clear. India is now wide awake. We shall prevail. We shall overcome.
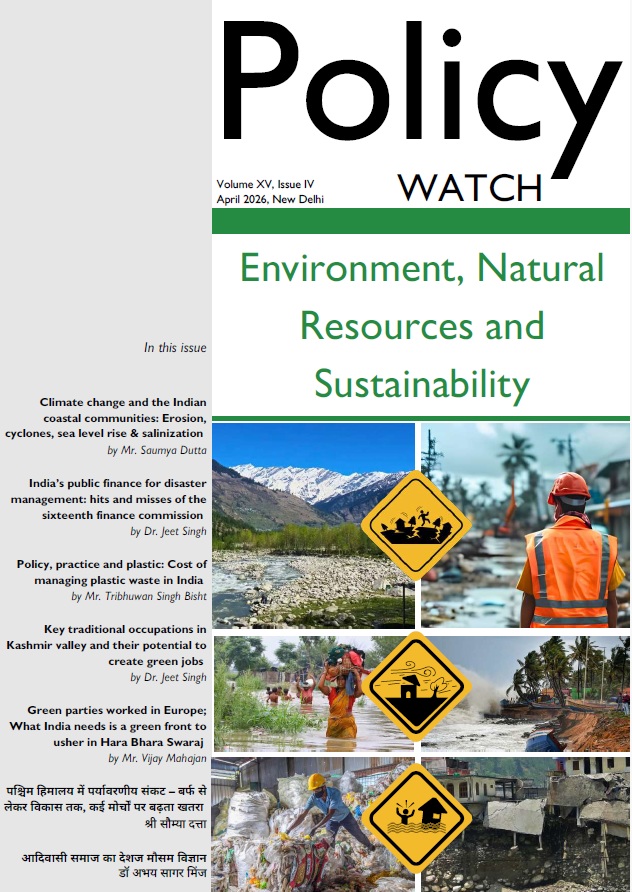
This issue of Policy Watch is dedicated to the fourth theme – Environment, Natural Resources and Sustainability – and has been compiled by Dr. Jeet Singh, Head of Research, RGICS, and the undersigned. It features
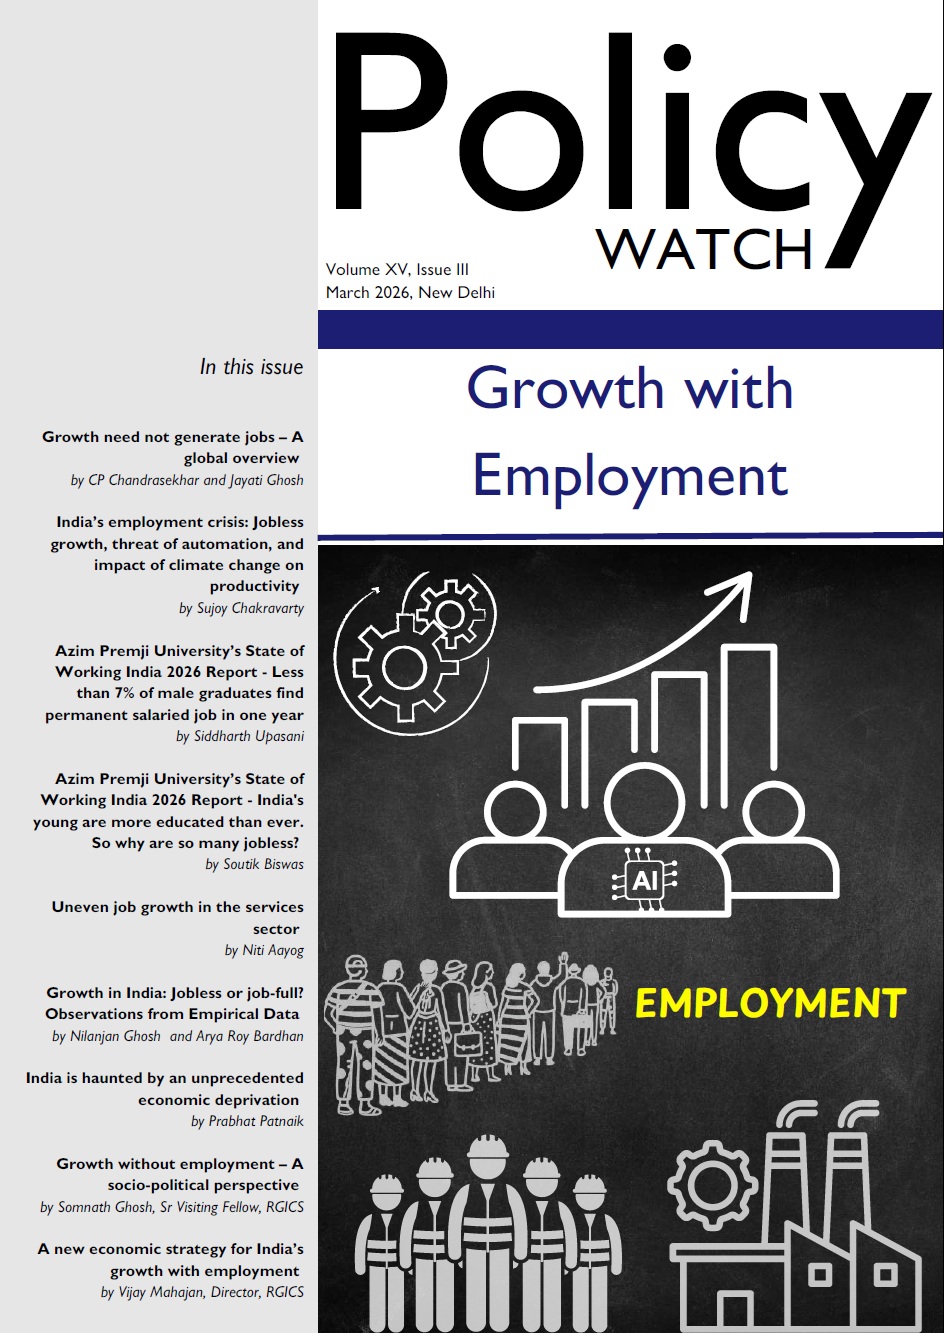
This issue of Policy Watch by the Rajiv Gandhi Institute for Contemporary Studies (RGICS), curated by Prof. Somnath Ghosh and Vijay Mahajan, brings together a curated set of articles—many of which have been previously published
Policy Watch: Governance and Development — Tribal Communities at the Centre This issue of Policy Watch, published by the Rajiv Gandhi Institute for Contemporary Studies (RGICS) under the theme Governance and Development, brings together critical