 No power on earth can stop an idea whose time has come .. the emergence of India as a major economic power in the world happens to be one such idea. Let the whole world hear it loud and clear. India is now wide awake. We shall prevail. We shall overcome.
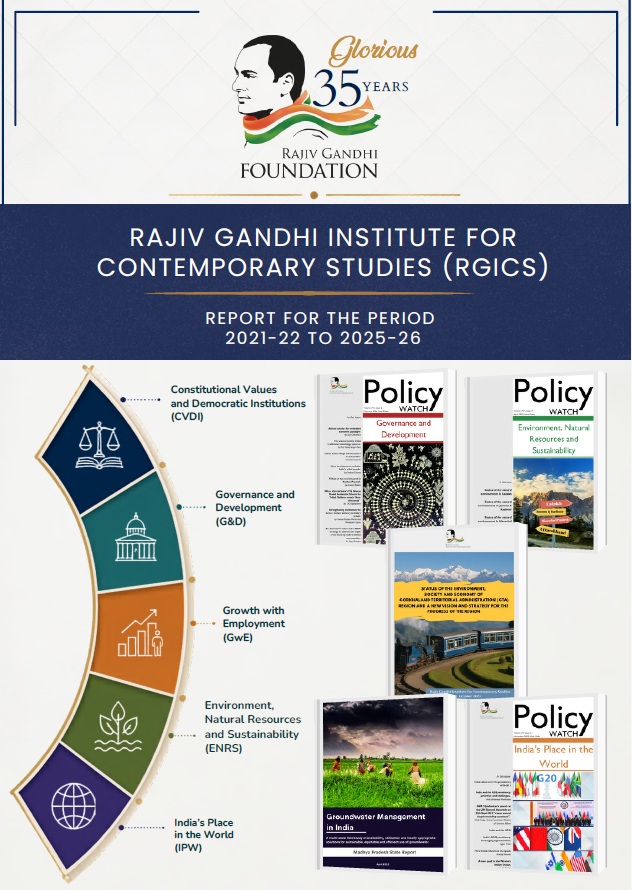
The RGICS believes that the policy making must be informed and inspired by what is happening on the ground. Moreover, our public policy making must strive to work towards ensuring equality of status, opportunity and
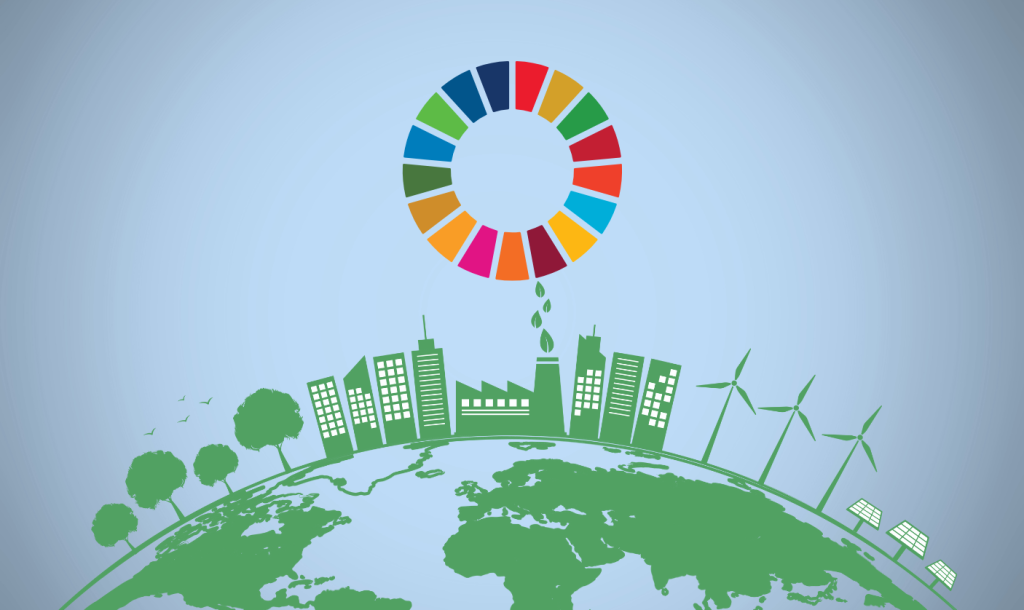
This issue of Policy Watch is dedicated to the fourth theme – Environment, Natural Resources and Sustainability – and has been compiled by Dr. Jeet Singh, Head of Research, RGICS, and the undersigned. It features
This issue of Policy Watch by the Rajiv Gandhi Institute for Contemporary Studies (RGICS), curated by Prof. Somnath Ghosh and Vijay Mahajan, brings together a curated set of articles—many of which have been previously published